Four Color Infographic Presentation Template Radar Graph
RJ0200037_6
- Last Update 04/08/2025
- File Size 0.2MB
- # of Slides 2
- File Format PPTX
- Slide Ratio 16:9
- Color
Keywords
- #Content-Based Slides
- #Design-Based Slides
- #Market and Competitor Analysis
- #Graph
- #Customer Analysis
- #Market Analysis
- #Other
- #Radar Chart Spider Chart
- #16:9
- #radar chart PowerPoint
- #5-point radar diagram slide
- #infographic PowerPoint template
- #market analysis chart
- #competitive analysis slide template
About the Product
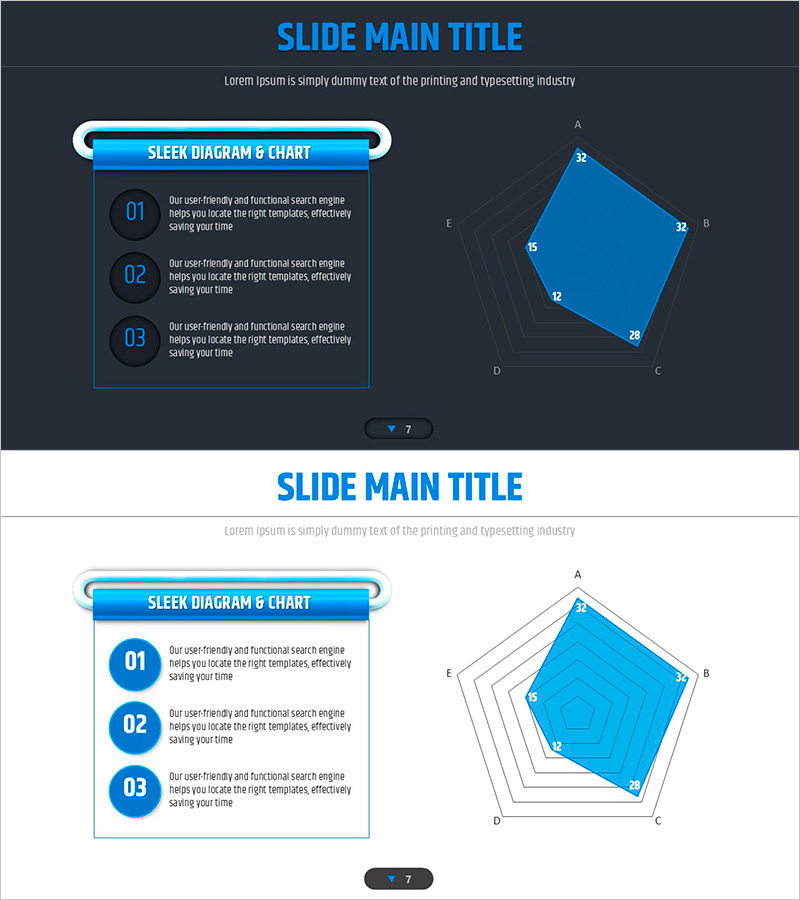
A PowerPoint slide featuring a 5-point radar chart with 4-color infographic design. The dark background version displays a solid blue-filled radar diagram, while the light background version shows a gradient-filled radar with outlined points. Perfect for market analysis, competitive positioning, capability assessment, and multi-dimensional evaluation presentations. Fully editable 2-slide template set ready for immediate use.
Usage Points
-
Main Usage
Visualize multi-dimensional evaluation of 5 key factors using a radar chart format. Ideal for market analysis, competitive positioning, product capability assessment, organizational capability evaluation, and performance benchmarking. Each axis accepts numerical data that automatically renders as a filled polygon area.
-
How to Use
Insert this slide in the analysis or evaluation section of your presentation. Use for competitive analysis in market entry strategy, technology capability assessment in product development, strength-weakness analysis in organizational diagnostics, and performance metrics comparison. Edit axis labels and input values to create customized analytical visuals.
-
Recommended For
Marketing strategists, management consultants, business analysts, product managers, organizational development professionals. Suitable for business plans, marketing proposals, consulting reports, executive presentations, and strategic analysis documents.
-
Slide Structure
2-slide set. Slide 1: Dark background with 3-item text box section and 5-point radar chart with solid blue fill. Slide 2: Light background with identical 5-point radar structure featuring blue outline and gradient fill. Each axis labeled A through E with editable numerical values and data points.
Related Products
-

Radial Charts in the Architectural Sector - Innovative Customer Analysis
#Market and Competitor Analysis #Graph #Customer Analysis
-

Table Chart on Competition and Communication - Market and Customer Analysis
#Market and Competitor Analysis #Diagram #Customer Analysis
-

Analyzing Chart Results by Item – Understanding the Market and Customers
#Market and Competitor Analysis #Graph #Other
-

Geometric Pattern Wide PPT Radar Chart – Optimized for Market Analysis Visualization
#Market and Competitor Analysis #Graph #Market Status
