Four Color Infographic Presentation Template Flow Linear Diagram – Business Implementation Strategy
RJ0200037_4
- Last Update 04/08/2025
- File Size 0.8MB
- # of Slides 2
- File Format PPTX
- Slide Ratio 16:9
- Color
Keywords
- #Content-Based Slides
- #Design-Based Slides
- #Business Strategy
- #Business Management
- #Diagram
- #Step-by-Step Schedule Plan
- #Implementation Schedule
- #Flow
- #Linear Flow
- #16:9
- #linear flow diagram PowerPoint
- #4-step process diagram
- #business strategy slide
- #how to create process flow in PowerPoint
- #sequential workflow PowerPoint template
About the Product
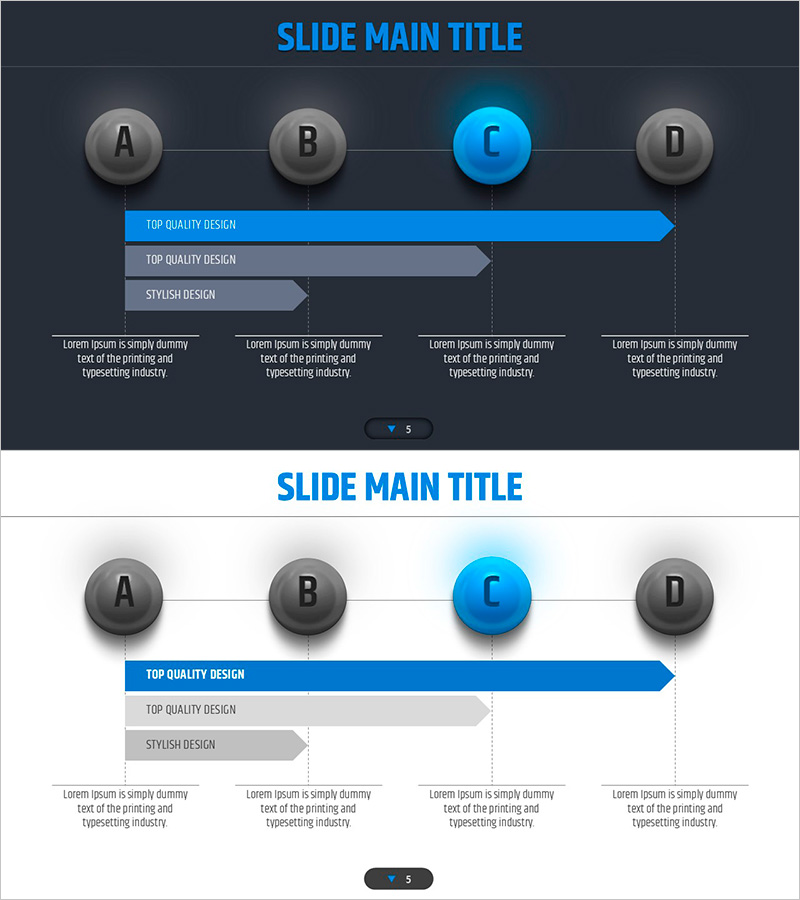
A linear flow diagram PowerPoint slide featuring four connected nodes representing sequential business processes. The design uses a dark gray background with blue and gray arrow bars and circular nodes to clearly express step-by-step progression. Each stage includes dedicated text description areas for detailing business implementation strategies, project timelines, and workflow processes. The 2-slide set includes both dark and light background versions, making it suitable for presentations and printed materials alike.
Usage Points
-
Main Usage
Ideal for visualizing 4-stage sequential processes such as business implementation strategies, project timelines, workflow procedures, marketing campaign phases, and product development roadmaps. Clearly communicates the progression and interdependencies between stages.
-
How to Use
Enter stage names in the circular nodes and add detailed descriptions in the text areas below each arrow bar. Adjust arrow bar lengths and colors to emphasize stage importance. Choose between dark or light background versions depending on your presentation environment.
-
Recommended For
Executives, project managers, marketing professionals, and strategy planning teams presenting business plans, project status updates, and marketing strategies. Particularly effective for investor presentations, strategic meetings, and departmental reports requiring clear process visualization.
-
Slide Structure
Four circular nodes (A, B, C, D) connected horizontally by lines, with three arrow bars (blue and gray) positioned below each node. Each arrow bar has a dedicated text area, accommodating up to 12 detailed items. 16:9 widescreen format with 2-slide set.
Related Products
-

Icon Box Roadmap Slide – Three-Stage Milestone PowerPoint
#Business Strategy #Business Management #Operational Plan
-

Trade Schedule and Stages – Step-by-Step Approach
#Business Strategy #Business Management #Diagram
-

Schedule Planning Arrow Diagram – Visualizing Step-by-Step Project Timelines
#Business Strategy #Business Management #Diagram
-

Step-by-Step Schedule Planning Flow Diagram – Effective Business Strategy
#Business Strategy #Business Management #Diagram
