Simple Car Wide Presentation Line Chart – Market and Competitive Analysis
RJ0200057_15
- Last Update 04/14/2025
- File Size 0.3MB
- # of Slides 2
- File Format PPTX
- Slide Ratio 16:9
- Color
Keywords
- #Content-Based Slides
- #Design-Based Slides
- #Market and Competitor Analysis
- #Financial Plans and Performance
- #Graph
- #Future Outlook
- #Sales and Revenue
- #Line
- #Line Chart
- #16:9
- #line chart PowerPoint
- #automotive market analysis presentation
- #3-series line graph
- #competitive analysis slide
- #market trend template
- #PowerPoint chart design
- #business data visualization
About the Product
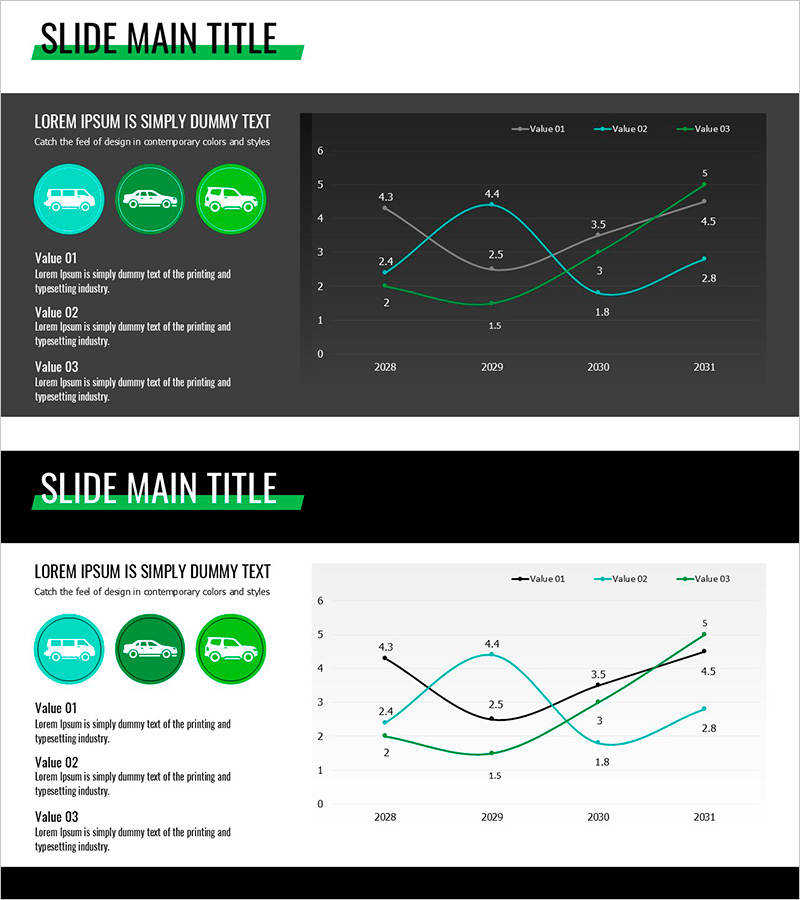
A line chart PowerPoint slide optimized for automotive industry market analysis and competitive performance comparison. This presentation template displays data from 2008 to 2031 across three series (Value 01, 02, 03) with cyan, green, and gray lines on a dark background for clear visual distinction. Each data point includes numerical values for precise comparison, while the left side features three circular icons with text areas to explain key metrics. The 16:9 widescreen format includes 2 slides ready for immediate editing and deployment in business presentations.
Usage Points
-
Main Usage
Effectively communicate automotive market size changes, sales trends, and competitive performance across three data series simultaneously, enabling clear trend analysis and performance benchmarking in executive presentations.
-
How to Use
Input metric definitions (sales volume, market share, revenue, etc.) in the left icon areas, then replace graph data points with actual figures. The dark background ensures excellent visibility in projector environments and professional presentation settings.
-
Recommended For
Ideal for automotive manufacturers, dealers, and parts suppliers presenting to executives, market analysis consultants, investor relations presentations, and business performance reviews. Suitable for finance, marketing, and strategy departments requiring data-driven decision-making materials.
-
Slide Structure
2-slide set with consistent layout: title area at top, left side with 3 circular icons and text descriptions, right side featuring 3-series line chart (X-axis: years, Y-axis: values, legend: Value 01·02·03) with data point labels.
Related Products
-

Changes in Forest Area – Market Analysis and Future Prospects
#Market and Competitor Analysis #Financial Plans and Performance #Graph
-

Camping Isometric Future Market Outlook Line Graph
#Market and Competitor Analysis #Financial Plans and Performance #Graph
-

Comparison Graph by Transportation Industry – Market Analysis and Financial Performance
#Market and Competitor Analysis #Financial Plans and Performance #Graph
-

Rising Curve Graph for Sales Growth – Looking Ahead
#Market and Competitor Analysis #Financial Plans and Performance #Graph
