Modern Blue Presentation Doughnut Chart – Market Share Analysis
RJ0200035_14
- Last Update 04/07/2025
- File Size 0.8MB
- # of Slides 2
- File Format PPTX
- Slide Ratio 16:9
- Color
Keywords
About the Product
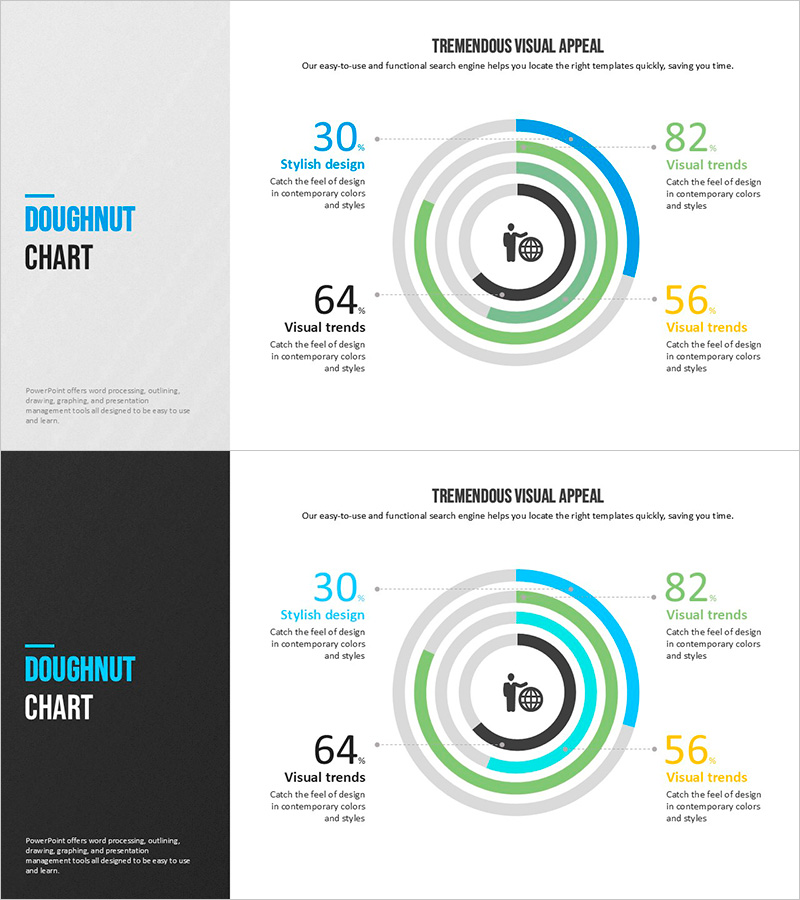
A professional doughnut chart PowerPoint slide designed to visualize market share, revenue composition, customer distribution, and budget allocation. The slide features a concentric ring structure with four color segments (blue, green, gray, and yellow) and a central icon for emphasizing key topics. This 2-slide template includes both light and dark background versions in 16:9 widescreen format, optimized for modern presentation environments. Each segment includes numeric labels and text areas for immediate data input and customization.
Usage Points
-
Main Usage
Effectively communicate proportional data such as market share, revenue breakdown, customer segments, and budget distribution. The central icon area highlights the main topic, while the four-color concentric rings represent hierarchical data structures with clear visual distinction between segments.
-
How to Use
Ideal for business reports, marketing presentations, investor pitches, quarterly performance reviews, and strategic planning sessions. Simply replace the numeric labels and text with your own data, and adjust colors to match your brand identity. The template is ready to use immediately without additional design work.
-
Recommended For
Finance professionals, marketing managers, executives, consultants, and data analysts who need to present quantitative insights. Particularly useful for competitive analysis, market assessment, internal performance evaluation, and any situation requiring ratio-based data visualization.
-
Slide Structure
Two-slide template with identical doughnut chart layouts on contrasting backgrounds: Slide 1 features a light gray background, Slide 2 a dark charcoal background. Each slide contains a central global icon, four-segment concentric doughnut graph with color differentiation, and four data points including numeric values, labels, and descriptive text areas.
Related Products
-

Doughnut Chart Visualizing Proportion of Grain Yields
#Market and Competitor Analysis #Graph #Market Status
-

Donut Chart PPT Template for Market Overview
#Market and Competitor Analysis #Graph #Market Status
-

Distribution Graph of Food Materials – Market Status Chart
#Market and Competitor Analysis #Graph #Other
-

Logistics Market Share Chart – Current Status and Competitive Analysis
#Market and Competitor Analysis #Graph #Market Status
