Curved Line Chart – Market Trend Analysis
RJ0900007_19
- Last Update 08/17/2025
- File Size 0.1MB
- # of Slides 2
- File Format PPTX
- Slide Ratio 16:9
- Color
Keywords
- #Content-Based Slides
- #Design-Based Slides
- #Market and Competitor Analysis
- #Graph
- #Industry Trends
- #Competitive Advantage
- #Line
- #Line Chart
- #16:9
- #line chart PowerPoint
- #multi-series line graph
- #trend analysis slide
- #3-series chart template
- #time series data visualization
- #PowerPoint chart slide download
About the Product
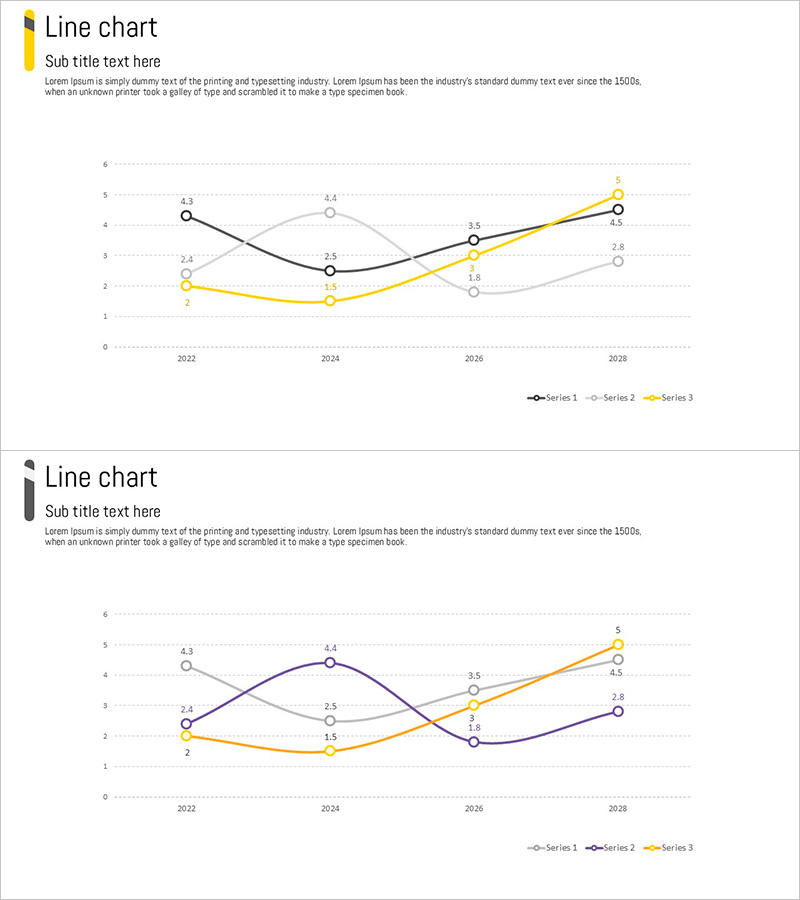
A multi-series line chart PowerPoint slide comparing market trends across four years from 2024 to 2028 using three distinct data series. The two-slide deck features black, yellow, and gray line series with clearly marked data points for each year, making it ideal for executive presentations, market analysis reports, and business performance reviews. Each slide includes title and subtitle areas with a legend, allowing you to easily customize the data and labels for your specific business context.
Usage Points
-
Main Usage
Visualize and compare multiple data series over time to identify trends, growth patterns, and competitive advantages. Ideal for presenting revenue growth, customer satisfaction scores, market share evolution, or any multi-variable performance metrics across consecutive years.
-
How to Use
Insert this slide into executive summary presentations, quarterly business reviews, investor pitch decks, or strategic planning documents. Click on data points to edit values, modify line colors, or adjust the legend to match your brand guidelines. The gridlines and axis labels help maintain clarity when presenting to stakeholders.
-
Recommended For
Financial analysts presenting quarterly earnings, marketing managers showcasing campaign performance metrics, business development professionals explaining market dynamics, management consultants delivering strategic insights, and operations leaders reporting KPI progress.
-
Slide Structure
Two-slide template featuring identical layouts with 3-series line charts. Each slide displays data from 2022 to 2028 with black, yellow, and gray lines representing Series 1, 2, and 3. Includes title area, subtitle text field, legend box, and gridlines for easy data point reading.
Related Products
-

Plotting Paper Presentation Template - Analyzing Market Trends with Line Chart
#Market and Competitor Analysis #Graph #Industry Trends
-

Idea Presentation Template Wide Line Chart
#Market and Competitor Analysis #Graph #Industry Trends
-

Dual Line Chart with Comments – Market Trend Analysis
#Market and Competitor Analysis #Graph #Text Box
-

Market Trend Line Graph – Effective Competitive Advantage Analysis
#Market and Competitor Analysis #Graph #Industry Trends
