Arctic Penguin Line Graph – Market Trend Analysis
RJ0600040_16
- Last Update 09/03/2025
- File Size 0.6MB
- # of Slides 4
- File Format PPTX
- Slide Ratio 16:9
- Color
Keywords
- #Content-Based Slides
- #Design-Based Slides
- #Market and Competitor Analysis
- #Graph
- #Industry Trends
- #Competitive Advantage
- #Line
- #Line Chart
- #16:9
- #line chart PowerPoint
- #market trend analysis slides
- #dual-series data visualization
- #business presentation template
- #how to create line graph in PowerPoint
About the Product
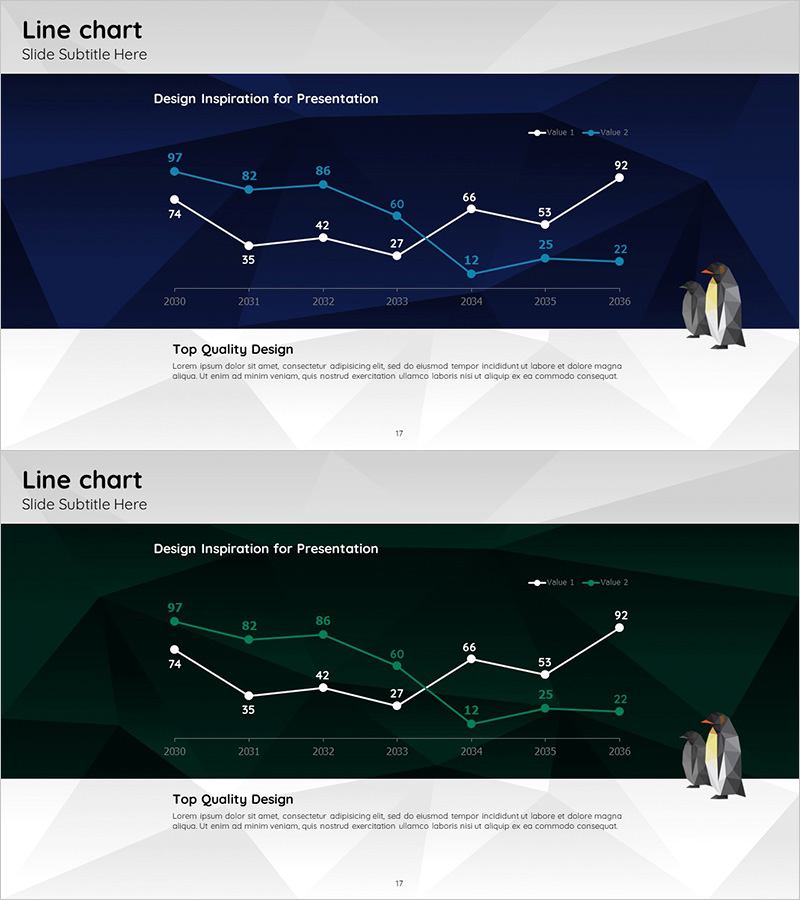
A professional line chart PowerPoint slide set featuring an Arctic penguin illustration and dual-series data visualization. The dark blue background displays two data series tracking market trends across seven years from 2030 to 2036, with precise numerical values marked at each data point. This four-slide presentation template is ready for immediate use in business reports, enabling clear comparison of competitive positioning, growth rates, customer satisfaction metrics, and other key performance indicators. The 16:9 widescreen format in PPTX ensures full compatibility with all PowerPoint versions and allows seamless editing of data, colors, and labels to match your corporate branding.
Usage Points
-
Main Usage
Designed to compare and analyze two data series over time, clearly illustrating trends in market growth, sales performance, customer satisfaction, and competitive benchmarking. The visual representation enables stakeholders to quickly identify patterns, inflection points, and performance gaps for informed decision-making.
-
How to Use
Replace the sample data points and numerical values with your actual business metrics. Customize the dark blue background and cyan/white line colors to align with your corporate identity. Edit the legend, axis labels, and title text directly within PowerPoint without requiring design software expertise.
-
Recommended For
Ideal for executive dashboards, quarterly earnings presentations, market analysis reports, investor relations meetings, marketing strategy sessions, and sales performance reviews. Finance teams, marketing departments, sales organizations, and business planning units will find this template essential for data-driven presentations.
-
Slide Structure
Four-slide set featuring identical line chart layouts in two background color variants: dark blue and dark green. Each slide displays two data series (Value 1 and Value 2) with seven data points spanning 2030-2036, connected by continuous lines. An Arctic penguin illustration positioned on the right side provides visual interest and brand differentiation.
Related Products
-

Plotting Paper Presentation Template - Analyzing Market Trends with Line Chart
#Market and Competitor Analysis #Graph #Industry Trends
-

Market Trend Line Graph – Effective Competitive Advantage Analysis
#Market and Competitor Analysis #Graph #Industry Trends
-

Curved Line Chart – Market Trend Analysis
#Market and Competitor Analysis #Graph #Industry Trends
-

Line Chart Template for Market Trends Visualization – Enhancing Competitive Advantage
#Market and Competitor Analysis #Graph #Industry Trends
