Idea Presentation Template Wide Pie Chart – Visualizing Achievements
RJ0200030_10
- Last Update 04/06/2025
- File Size 0.7MB
- # of Slides 2
- File Format PPTX
- Slide Ratio 16:9
- Color
Keywords
About the Product
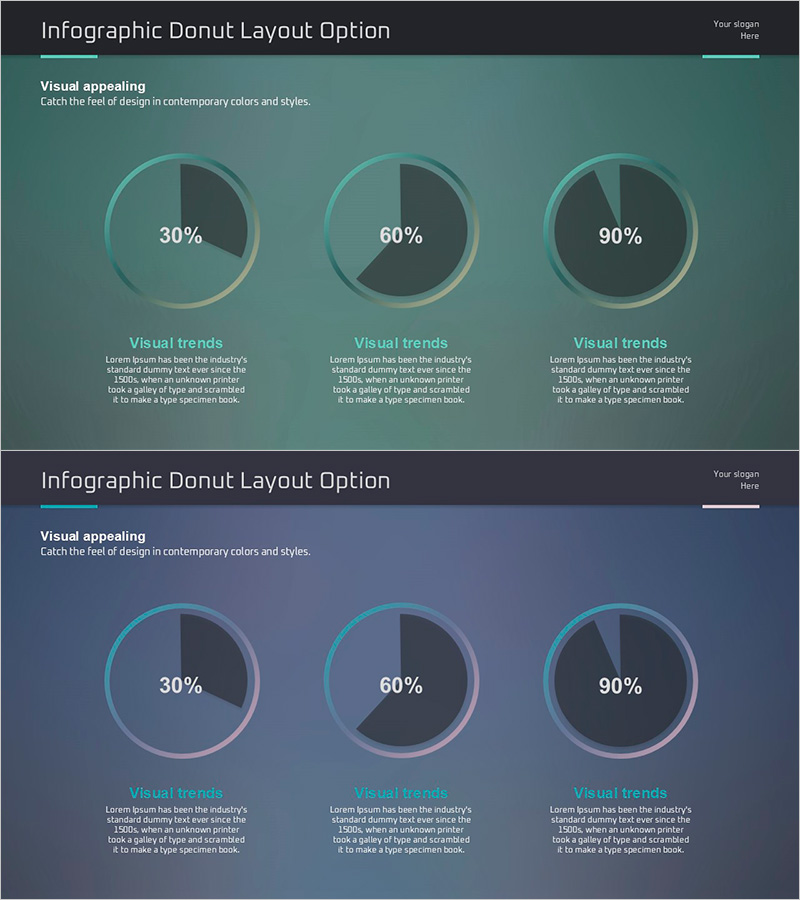
This free PowerPoint slide features three donut charts arranged in a clean three-column layout, designed to visualize ratios, achievement rates, and KPI metrics at a glance. The slide comes in two dark color themes — a deep teal version and a dark blue-gray version — giving you flexibility to match your presentation's visual tone. Each donut chart displays a percentage value at its center (30%, 60%, 90%), with a teal-to-gold gradient ring that stands out clearly against the dark background. Below each chart, dedicated title and description text areas allow you to add context for each data point. The PPTX format makes it easy to replace numbers and text with your own data, making this slide ready to drop into performance reports, business plans, marketing decks, or investor pitch presentations. For a wider collection of graph and chart slides, explore the full library at GoodPello.
Usage Points
-
Main Usage
This slide is designed to visually compare three key metrics or achievement rates side by side using donut charts, making it ideal for highlighting KPIs, completion rates, or percentage-based data in a single, impactful slide.
-
How to Use
Replace the percentage values inside each donut chart and update the title and description text below each chart with your actual data. Choose between the dark teal or dark blue-gray color theme to match your presentation style, then insert the slide directly into your deck.
-
Recommended For
Best suited for business analysts, marketers, startup founders, and project managers who need to present ratio data, performance metrics, or KPI dashboards in performance reports, business plans, marketing presentations, or investor pitch decks.
-
Slide Structure
Single-slide layout with 3 donut charts arranged in a 3-column grid. Each chart includes a center percentage value, a teal-gold gradient ring, and a title plus description text area below. Top header includes a title field and slogan area.
Related Products
-

Vertical Bar Chart Visualizing Candidate Values – Trends and Choices
#Free Graphs
-

Business Comparison Analysis Graph – Strengthening Market and Competitor Analysis
#Free Graphs
-

Competitor Analysis and Market Trend Graph – Blue, Orange, Green Colors
#Free Graphs
-

Vertical Bar Chart for Data Analysis – Business Insights
#Free Graphs
