Modern Business Presentation Template Doughnut Chart1 – Visualizing Performance and Strategy
RJ0200028_8
- Last Update 04/05/2025
- File Size 6.9MB
- # of Slides 2
- File Format PPTX
- Slide Ratio 16:9
- Color
Keywords
- #Content-Based Slides
- #Design-Based Slides
- #Business Strategy
- #Risk Management and Regulatory Compliance
- #Graph
- #Other
- #Achievements
- # Risk Management Strategy
- #Circles
- #Doughnut Chart
- #Silhouette
- #16:9
- #doughnut chart PowerPoint
- #pie chart presentation slide
- #data visualization template
- #performance analysis PPT
- #business chart slide template
About the Product
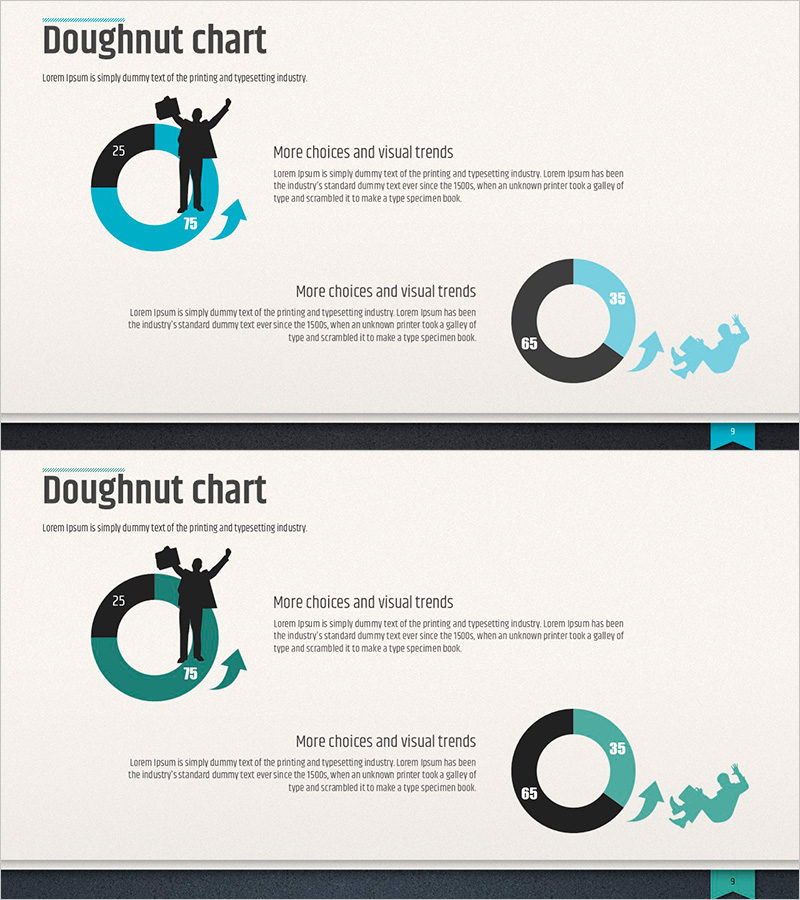
A professional doughnut chart PowerPoint slide set featuring 2 slides designed for business presentations. This presentation template uses a blue and charcoal two-tone color scheme to visualize performance metrics and strategic data with clarity. Each slide positions the doughnut chart on the left with numerical values centered, and provides an explanation area on the right for comparative data analysis. Available in 16:9 widescreen PPTX format, fully editable and ready for business reports, performance analysis, risk management presentations, and quarterly reviews.
Usage Points
-
Main Usage
Visualize 2-3 key performance indicators, strategic targets, or risk factors using doughnut charts for executive reports, quarterly performance presentations, and business planning sessions. The centered numerical emphasis ensures immediate recognition of critical metrics.
-
How to Use
Replace the doughnut chart values and legends with your own data, then add interpretation and insights in the right-side text area. The blue and charcoal color scheme can be adjusted to match your corporate branding. Use the 2-slide structure for comparative analysis or sequential explanation of related metrics.
-
Recommended For
Recommended for finance, executive management, marketing, and sales teams presenting quarterly or annual performance reports, investor presentations, business planning meetings, and risk management updates. Ideal for conveying quantitative data concisely in executive-level meetings.
-
Slide Structure
Both slides feature identical layout: doughnut chart (2-3 segment split) on the left with blue & charcoal tones, numerical values displayed in the center, and title/description text area on the right. Arrow icons indicate upward or downward trends. Optimized for 16:9 widescreen displays and modern projectors.
Related Products
-

Soccer Game Illustration Graph for Market and Competitive Analysis
#Business Strategy #Market and Competitor Analysis #Graph
-

Future Target Market Share Donut Chart – Performance and Competitiveness
#Business Strategy #Market and Competitor Analysis #Graph
-

Market Status Chart Analysis – Data-Driven Insights
#Business Strategy #Market and Competitor Analysis #Graph
-

Visualizing Key Achievements with Blue Line Donut Chart – Business Strategy
#Company Introduction #Business Strategy #Graph
