Effective Note Template Table for Cash Flow Statements
RB0800020_11
- Last Update 03/21/2025
- File Size 1.3MB
- # of Slides 2
- File Format PPTX
- Slide Ratio 4:3
- Color
Keywords
About the Product
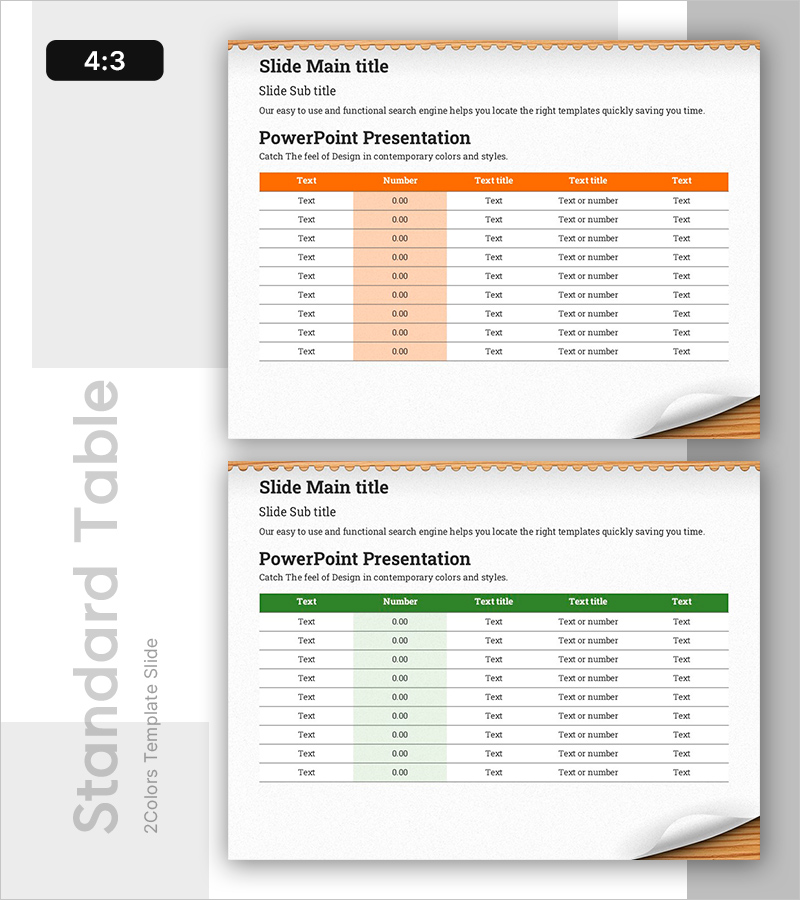
A horizontal data table PowerPoint slide with 5 columns and 9 rows, designed for organizing financial information and performance metrics. The two-slide set features a dual-tone header design with orange and green color schemes, making it ideal for cash flow statements, budget analysis, and financial reporting. Each row provides input areas for text and numerical data, allowing easy customization for various financial presentations. The clean layout with beige background and white rows ensures clear readability during presentations and reports.
Usage Points
-
Main Usage
Organize and compare financial data, budget figures, and performance metrics in a structured row-and-column format. The color-coded headers (orange and green) create visual hierarchy and guide audience attention to key information during financial presentations.
-
How to Use
Insert this table slide into business plans, quarterly financial reports, investor pitch decks, and budget presentations. Replace placeholder text and numbers with actual data. Adjust row height and column width as needed to accommodate your specific data volume and formatting requirements.
-
Recommended For
Finance professionals, CFOs, project managers, and business executives presenting financial statements, budget analysis, and performance reviews. Ideal for banking, investment, consulting, and corporate environments where data-driven decision-making is critical.
-
Slide Structure
Two-slide template with identical 5-column, 9-row table structure. First slide features orange header row; second slide uses green header. Both include beige background with white data rows for optimal contrast and readability. All cells are fully editable for custom data entry.
Related Products
-

Table Chart with Light Background – Financial Planning Tool
#Financial Plans and Performance #Diagram #Cash Flow Statement
-

Square Frame Presentation Template for Financial Performance – Efficiency and Clarity
#Financial Plans and Performance #Diagram #Cash Flow Statement
-

Denim PPT Table Chart – Clearly Presenting Financial Performance
#Financial Plans and Performance #Diagram #Cash Flow Statement
-

Basic Red Green Table – Visualizing Financial Performance
#Financial Plans and Performance #Diagram #Cash Flow Statement
