Rainbow Template for Financial Planning & Performance Charts and Icons
RJ0200022_13
- Last Update 04/03/2025
- File Size 3.9MB
- # of Slides 2
- File Format PPTX
- Slide Ratio 16:9
- Color
Keywords
About the Product
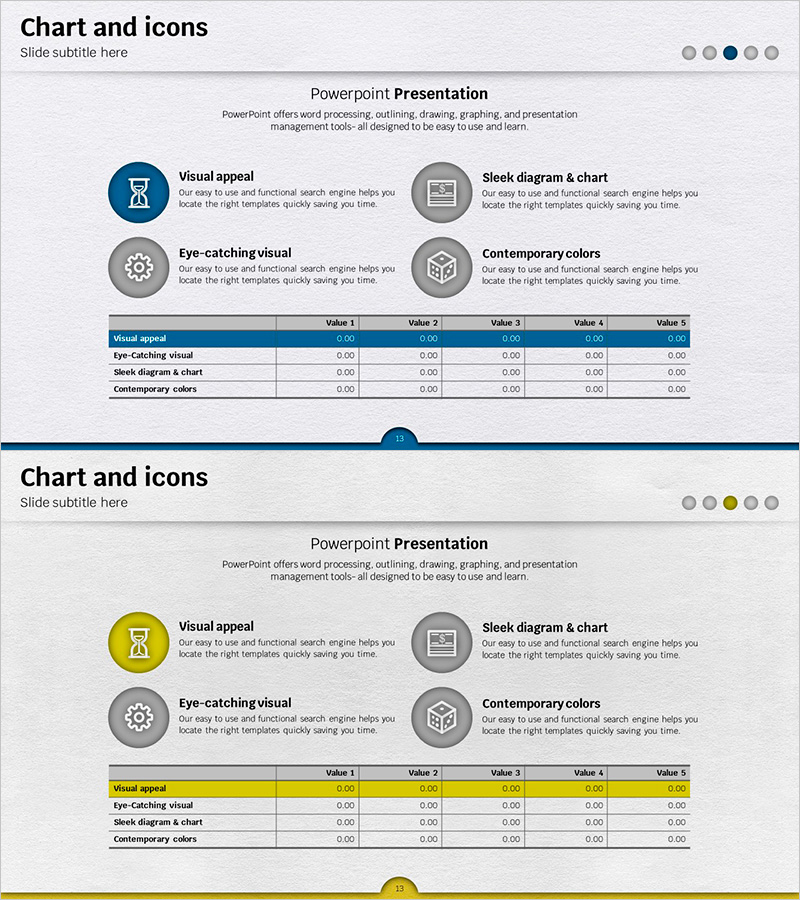
A 5-column data table PowerPoint slide designed for financial planning and performance analysis. Features three color schemes: navy blue, yellow, and gray, with four rows for data entry and five columns for numerical values. Includes circular icons (hourglass, gear, cube, palette) for visual emphasis. Ideal for financial reports, performance reviews, and budget planning presentations. Comprises 2 slides in 16:9 widescreen format, fully editable and ready to use.
Usage Points
-
Main Usage
Visualize financial metrics, quarterly performance, and budget comparisons. The 5-column structure allows side-by-side analysis of fiscal data, while circular icons highlight key categories. Enables stakeholders to quickly grasp financial trends and performance indicators.
-
How to Use
Use in financial reports, quarterly earnings presentations, and budget planning meetings. Enter category names in rows and corresponding numerical values in the five columns. Apply color highlighting to emphasize critical metrics and draw audience attention to key performance indicators.
-
Recommended For
Finance teams, CFOs, controllers, business unit leaders, and executives presenting quarterly or annual results to boards, shareholders, and management. Suitable for budget allocation, cost analysis, revenue forecasting, and comparative financial assessments.
-
Slide Structure
2-slide set with title area, 4-row × 5-column data table, and 4 circular icons (hourglass, gear, cube, palette) positioned on the left. First slide features navy header; second slide uses yellow header for visual variation and emphasis.
Related Products
-

Triangle Pattern PPT Table Chart – Visualizing Financial Performance
#Financial Plans and Performance #Diagram #Balance Sheet
-

Modern Blue Table Chart Presentation Template
#Financial Plans and Performance #Diagram #Balance Sheet
-

Business Plan PowerPoint Design – Excel Table Utilization
#Financial Plans and Performance #Diagram #Balance Sheet
-

Volume Presentation Template - Laptop Mockup and Table Chart for Modern Proposals
#Financial Plans and Performance #Diagram #Other
