Financial Indicator Text Table – Financial Performance Analysis
RJ0600055_8
- Last Update 07/05/2025
- File Size 5.7MB
- # of Slides 2
- File Format PPTX
- Slide Ratio 16:9
- Color
Keywords
- #Content-Based Slides
- #Design-Based Slides
- #Financial Plans and Performance
- #Diagram
- #Budget
- #Key Financial Indicators
- #Table
- #Standard Table
- #16:9
- #financial indicator table PowerPoint
- #text table slide template
- #financial performance analysis presentation
- #budget data table PPT
- #financial report slide design
About the Product
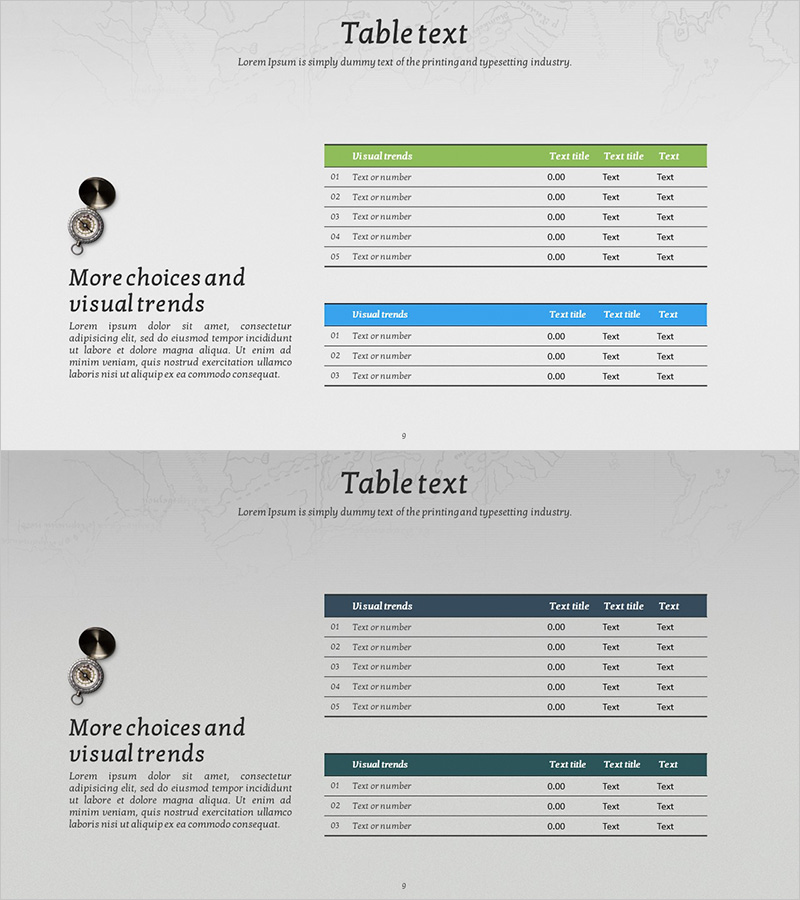
A text-based table PowerPoint slide designed for financial performance analysis and reporting. The slide features two color-coded table headers—green and blue—each containing five rows of data fields for organizing financial metrics, budget figures, and key performance indicators. A compass icon and descriptive text are positioned on the left side to create visual balance and context. This slide deck is ideal for financial professionals, CFOs, investment analysts, and corporate finance teams presenting quarterly earnings, budget reviews, investor relations materials, and performance reports. The 2-slide set is formatted in 16:9 aspect ratio PPTX.
Usage Points
-
Main Usage
Organize and present financial metrics, budget status, and key performance indicators in a clear, structured table format. Enables financial professionals, CFOs, and investment teams to support data-driven decision-making in quarterly earnings reports, investor presentations, executive briefings, and financial performance reviews.
-
How to Use
Replace the placeholder text and numerical data in each table row with your actual financial information. Apply the green header for positive performance metrics or target achievements, and use the blue header for comparative analysis or trend data. Enhance the left-side text area with key insights or analytical conclusions to strengthen your presentation narrative.
-
Recommended For
CFOs, finance managers, investment analysts, corporate executives, financial institution employees, and IR teams presenting quarterly results, financial reports, investor relations materials, budget planning sessions, and performance evaluation meetings. Particularly effective for finance, banking, insurance, and securities industries requiring credible, data-driven presentations.
-
Slide Structure
2-slide set with one 5-row × 4-column text table per slide. First slide features a green header (Unusual trends), second slide has a blue header (Unusual trends). Left side includes a compass icon, title text 'More choices and visual trends,' and descriptive paragraph for context and visual balance.
Related Products
-

Green Standard Table – Financial Planning and Budget Analysis
#Financial Plans and Performance #Diagram #Budget
-

Eco-friendly Business Budget Table Chart - Simple and Functional Design
#Financial Plans and Performance #Diagram #Budget
-

Budget Table for Financial Analysis – Concise and Clear Data Presentation
#Financial Plans and Performance #Diagram #Budget
-

Eco-friendly Business Project Main Financial Indicators and Budget Table
#Financial Plans and Performance #Diagram #Budget
