Business Strategy Direction Analysis Table – Financial Planning and Performance
RM0100001_6
- Last Update 01/24/2025
- File Size 2.1MB
- # of Slides 2
- File Format PPTX
- Slide Ratio 16:9
- Color
Keywords
- #Content-Based Slides
- #Design-Based Slides
- #Financial Plans and Performance
- #Diagram
- #Income Statement
- #Key Financial Indicators
- #Table
- #Standard Table
- #16:9
- #business strategy analysis table
- #financial planning PowerPoint slide
- #performance comparison template
- #3-column table PPT
- #strategy direction presentation
About the Product
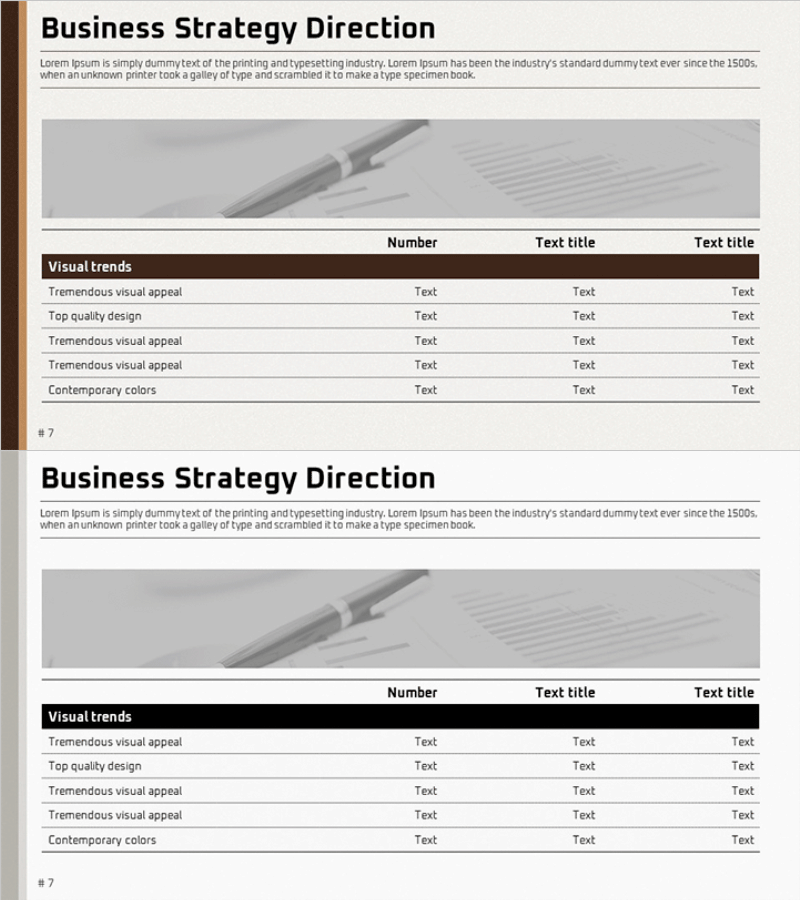
A professional three-column table-format PowerPoint slide designed for presenting business strategy and financial planning data. The slide features a minimalist gray background with a black header row and white input cells, allowing you to organize strategic direction, financial metrics, and performance indicators side by side. This 2-slide deck in 16:9 widescreen PPTX format is ready to edit and perfect for corporate reports, strategy meetings, investor presentations, and executive briefings. Each row accommodates visual trends, design quality, and contemporary color schemes for comprehensive business analysis.
Usage Points
-
Main Usage
Present and compare business strategy direction, financial planning metrics, and performance results in a structured table format. The three-column layout enables side-by-side analysis of strategic initiatives, financial data, and outcome measurements for clear decision-making.
-
How to Use
Fill each row with relevant strategy elements (visual trends, design quality, color schemes) and input specific content, numerical data, and evaluations across the three columns. Use in boardroom presentations, executive reports, investor pitches, and strategic planning sessions to systematically communicate business direction.
-
Recommended For
CFOs, strategy managers, business development teams, and executives conducting quarterly performance reviews, annual strategy planning, and investor relations presentations. Ideal for scenarios requiring parallel comparison of financial forecasts versus actual results.
-
Slide Structure
2-slide deck with consistent layout. Each slide contains a title area and a 3-column data table. The table header features a black background with white text (Number, Text title, Text title), followed by 5 editable rows with white cells. All text and data fields are fully customizable for your specific business metrics.
Related Products
-

Space Illustration Theme Chart – Income Statement and Key Financial Metrics
#Financial Plans and Performance #Diagram #Income Statement
-

Table Chart of Point Frames – Profit and Loss Statement and Key Financial Metrics
#Financial Plans and Performance #Diagram #Income Statement
-

Table Slide Visualizing Financial Performance with DNA Theme
#Financial Plans and Performance #Diagram #Income Statement
-

Visualizing Financial Performance with Business Table Chart – Intuitive and Effective
#Financial Plans and Performance #Diagram #Income Statement
