Modern Business Plan Line Diagram – Visualizing Market Strategy
RJ0200015_7
- Last Update 04/01/2025
- File Size 5.2MB
- # of Slides 2
- File Format PPTX
- Slide Ratio 16:9
- Color
Keywords
- #Content-Based Slides
- #Design-Based Slides
- #Market and Competitor Analysis
- #Marketing Plan and Strategy
- #Graph
- #Future Outlook
- #Marketing Objectives
- #Line
- #Line Chart
- #16:9
- #line graph PowerPoint slide
- #trend data visualization template
- #multi-series chart PowerPoint
- #time-series graph slide
- #market analysis chart
- #business data presentation slide
About the Product
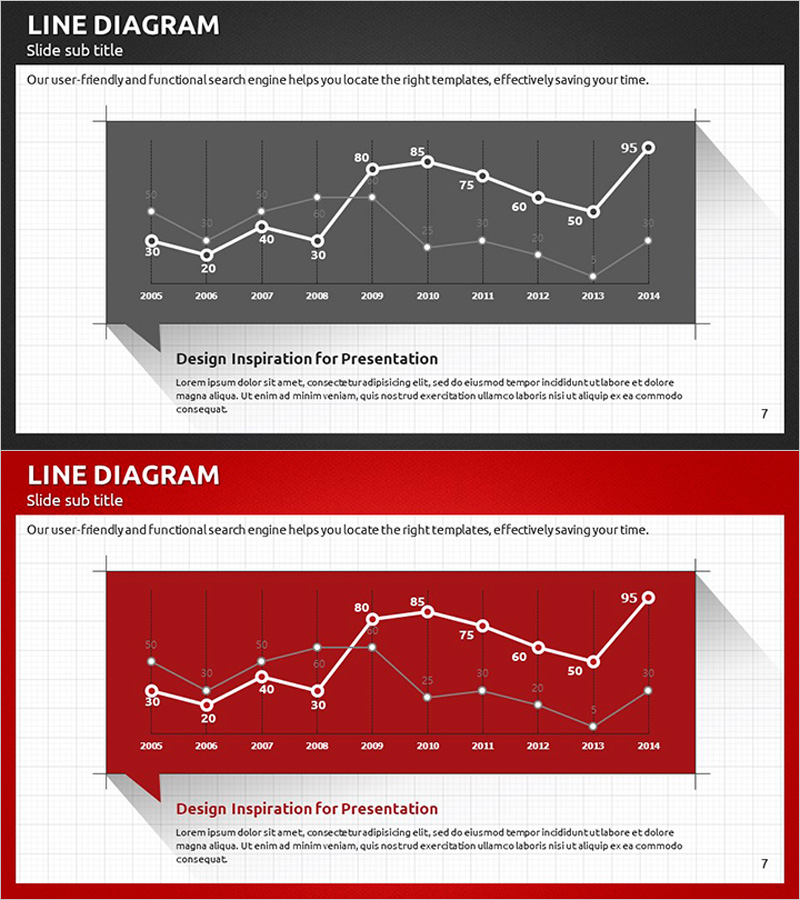
A professional line chart PowerPoint slide visualizing 10-year market trend data from 2005 to 2014. This presentation template features dual-series line graphs with clearly labeled data points, gridlines for easy value reading, and two color versions (gray and red backgrounds). Each data point displays numerical values, making precise trend analysis and performance comparison straightforward. Ideal for business presentations, marketing strategy reports, market analysis documents, and investor pitch decks requiring time-series data visualization.
Usage Points
-
Main Usage
Visualize continuous data changes over time, such as market trends, sales performance, and key performance indicators. Compare multiple data series simultaneously to demonstrate competitive positioning, quarterly growth rates, customer satisfaction trends, and strategic performance metrics.
-
How to Use
Apply this slide to marketing strategy presentations, business performance reports, investor relations materials, and market analysis sections. Edit data point values with your actual figures for immediate use. Select the color version that matches your presentation's overall tone and branding.
-
Recommended For
Marketing managers, executives, financial analysts, management consultants, and sales leaders presenting market insights and performance metrics. Suitable for quarterly business reviews, annual strategy planning, competitive analysis presentations, and investor communications.
-
Slide Structure
Two-slide set featuring gray and red background versions. Each slide contains a line graph with two data series, 10 data points spanning 2005-2014, numerical labels on each point (ranging 20-95), gridlines for reference, and a legend. The layout supports clear trend identification and multi-series comparison.
Related Products
-

Future Outlook and Expected Effects Graph – Harmony of Blue and Orange
#Business Strategy #Market and Competitor Analysis #Graph
-

Blue Green Break Line Chart Analysis – Business Strategy and Market Analysis
#Business Strategy #Market and Competitor Analysis #Graph
-

Trend in the Number of Crimes – Visual Data Analysis
#Business Strategy #Market and Competitor Analysis #Graph
-

Comparison Graph by Transportation Industry – Market Analysis and Financial Performance
#Market and Competitor Analysis #Financial Plans and Performance #Graph
