Square Frame Infographic Elements Slide – Perfect Combination of Business Vision and Financial Planning
RJ0200014_12
- Last Update 04/01/2025
- File Size 4.4MB
- # of Slides 2
- File Format PPTX
- Slide Ratio 16:9
- Color
Keywords
- #Content-Based Slides
- #Design-Based Slides
- #Business Vision and Strategy
- #Financial Plans and Performance
- #Diagram
- #Business Goals
- #Cash Flow Statement
- #Table
- #Standard Table
- #16:9
- #infographic data table PowerPoint
- #diamond icon slide template
- #comparison analysis presentation
- #business metrics PPT slide
- #financial planning PowerPoint template download
About the Product
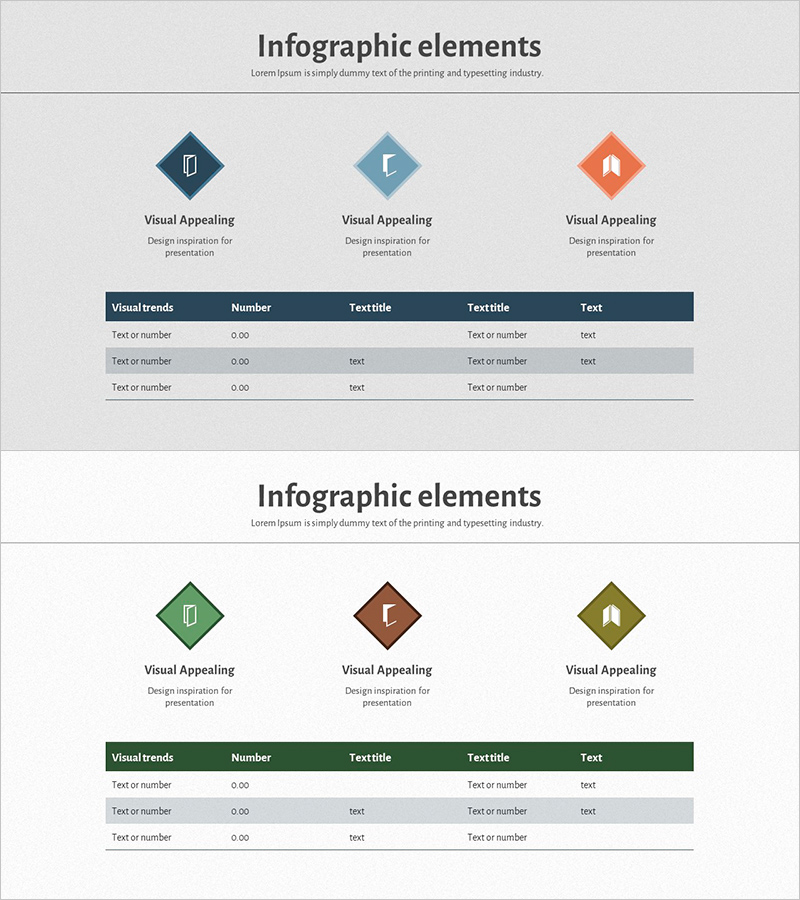
A professional infographic PowerPoint slide combining diamond-shaped icon frames with data tables to visualize business vision and financial planning. Features three distinct color schemes—dark blue, light blue, and coral orange—with corresponding diamond icons and structured data tables for clear information hierarchy. Each slide integrates icon areas with multi-column data tables, enabling systematic placement of metrics, descriptions, and categories. The 16:9 widescreen format includes 2 ready-to-use slides suitable for executive presentations, financial reports, strategic planning sections, and comparative analysis in business decks.
Usage Points
-
Main Usage
Transform business metrics, financial data, and performance indicators into visually compelling infographics using diamond-framed icons paired with structured data tables. The three-color coding system enables intuitive category differentiation, while the organized table layout ensures clear numerical and textual information hierarchy for executive-level presentations.
-
How to Use
Input core concepts into the diamond icon areas and populate table cells with numerical data, descriptions, and category labels. Use color-coded sections to distinguish departments, time periods, or comparison metrics. Insert into business plans, investor pitch decks, quarterly reports, or strategic presentations. Customize text and number sizes to emphasize key data points and adjust table dimensions to fit your content.
-
Recommended For
Finance professionals, business strategists, and executives presenting performance metrics, financial forecasts, and strategic initiatives. Ideal for investor relations presentations, quarterly business reviews, strategic planning documents, marketing proposals, and comparative analysis reports. Also suitable for academic presentations and consulting proposals requiring data visualization.
-
Slide Structure
Two-slide template with consistent layout: title area at top, three diamond-shaped icons (dark blue, light blue, coral) in center section, and five-column data table below. Table header features dark blue background with white text; data rows use alternating light gray backgrounds for readability. Each icon includes text input area for descriptive labels and metrics.
Related Products
-

Origami Presentation Template Section Table – Showcase Financial Performance
#Financial Plans and Performance #Diagram #Cash Flow Statement
-

Check Pattern Template Table – Financial Planning and Budget Management
#Financial Plans and Performance #Diagram #Cash Flow Statement
-

Circular Gradient Table – Financial Performance and Differentiation
#Financial Plans and Performance #Diagram #Balance Sheet
-

Four Color Infographic Presentation Table – Visualizing Financial Performance
#Financial Plans and Performance #Diagram #Balance Sheet
