Shape Configuration Diagram – Visualizing Technology Sectors
RJ0200012_11
- Last Update 03/31/2025
- File Size 1.3MB
- # of Slides 2
- File Format PPTX
- Slide Ratio 16:9
- Color
Keywords
- #Content-Based Slides
- #Design-Based Slides
- #Technical Approach
- #Diagram
- #Service Architecture Diagram
- #System Architecture Diagram
- #Cluster
- #Chain Diagram
- #16:9
- #connection diagram PowerPoint
- #4-node process flow slide
- #system architecture diagram template
- #cluster diagram PPT
- #technology sector visualization slide
About the Product
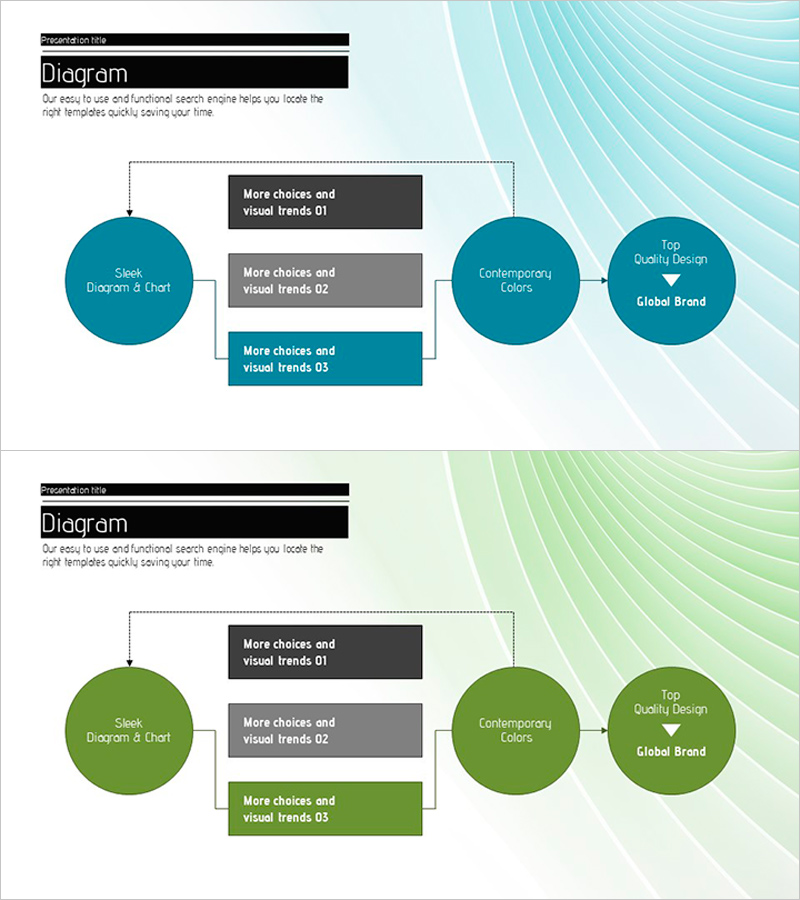
A PowerPoint slide featuring four circular nodes connected by directional arrows to illustrate process flow and relationships. The design uses teal blue and charcoal gray color contrast to emphasize each stage, with three central box elements for additional information input. Ideal for technology sector presentations, service architecture explanations, and system configuration diagrams that require clear visualization of complex interconnections in business and technical contexts.
Usage Points
-
Main Usage
Effectively communicates relationships and flow between four key elements such as technology sectors, service components, or system modules. The three central information boxes allow detailed explanations for each stage, making it ideal for breaking down complex processes into understandable sequential steps.
-
How to Use
Enter key concepts or department names in each circular node, and add detailed descriptions or trend information in the central box elements. Guide your audience through the process flow by following the arrow direction. Customize colors to highlight specific emphasis points and adapt to your presentation theme.
-
Recommended For
Recommended for IT professionals, technology strategists, product managers, consultants, and executives presenting technology strategy, service architecture, system configuration diagrams, or business process flows. Suitable for technical documentation, architectural overviews, and strategic planning presentations.
-
Slide Structure
Four circular nodes arranged in sequence (one left, one center, two right) connected by directional arrows. Three rectangular information boxes positioned centrally for data input. Background features gradient line patterns for visual depth. Two-slide set includes color variations in teal blue and green for design flexibility.
Related Products
-

Innovative Diagram for Food Ingredient Composition
#Technical Approach #Diagram #Service Architecture Diagram
-

Core Services Connection Diagram – Visualizing System and Service Compositions
#Technical Approach #Diagram #Service Architecture Diagram
-

Core Values Linked to the Central System
#Technical Approach #Diagram #Service Architecture Diagram
-

Chromosome Theme Wide PowerPoint Template – Stylish Diagram Composition
#Technical Approach #Diagram #Service Architecture Diagram
