Five Color Powerpoint Template – Distinctive Graph Design
RJ0200009_13
- Last Update 03/30/2025
- File Size 4.5MB
- # of Slides 2
- File Format PPTX
- Slide Ratio 16:9
- Color
Keywords
- #Content-Based Slides
- #Design-Based Slides
- #Market and Competitor Analysis
- #Marketing Plan and Strategy
- #Graph
- #Industry Trends
- #Marketing Strategy
- #Column
- #Column Chart
- #16:9
- #clustered column chart PowerPoint
- #positive negative comparison slide
- #data visualization PPT
- #bar graph PowerPoint template
- #financial analysis slide template
About the Product
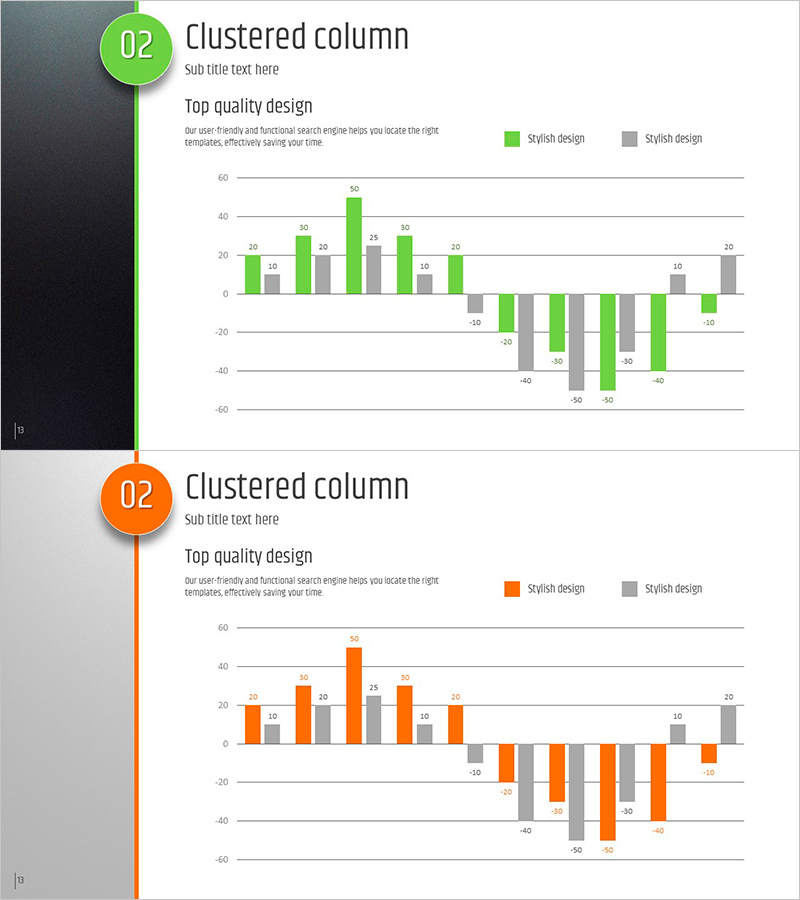
A clustered column chart PowerPoint slide designed to display positive and negative data simultaneously. The slide features lime green, orange, and gray color schemes to distinguish between two data series, with both horizontal and vertical bar layouts provided. Data points are positioned above and below a baseline axis, making comparative analysis intuitive and visually clear. Both slides include editable title and subtitle areas with fully customizable charts, enabling immediate use for data-driven presentations.
Usage Points
-
Main Usage
Compare financial performance, sales results, cost savings, and other metrics where positive and negative values must be analyzed side-by-side. Ideal for presenting goal achievement rates, profitability analysis, and profit-loss structures in executive presentations.
-
How to Use
Double-click the chart area to input your data; bar heights adjust automatically. Customize colors and data series as needed, then edit the title and legend to match your presentation topic.
-
Recommended For
Finance teams presenting quarterly earnings reports, marketing teams analyzing campaign effectiveness, sales teams evaluating target achievement, and executive management reports. Particularly effective for break-even analysis, ROI comparisons, and budget allocation explanations.
-
Slide Structure
2-slide set. Slide 1: Horizontal clustered column chart with lime green and gray series (approximately 10 data points, mixed positive-negative values). Slide 2: Vertical clustered column chart with orange and gray series (approximately 10 data points, mixed positive-negative values). Each slide features title and subtitle area at top, chart area at bottom.
Related Products
-

Market Trends and Analysis – Harmony of Blue and Red
#Market and Competitor Analysis #Diagram #Graph
-

Triangular Bar Graph of Learning Metrics – Market and Competitor Analysis
#Market and Competitor Analysis #Graph #Market Status
-

Marketing Strategy Diagram & Graph – Optimized for Market and Competitive Analysis
#Market and Competitor Analysis #Marketing Plan and Strategy #Diagram
-

Market Trends and Analysis Charts – Delivering Business Insights
#Business Strategy #Market and Competitor Analysis #Graph
