Five Color Infographic Element PowerPoint Template
RJ0200009_11
- Last Update 03/30/2025
- File Size 4.6MB
- # of Slides 2
- File Format PPTX
- Slide Ratio 16:9
- Color
Keywords
About the Product
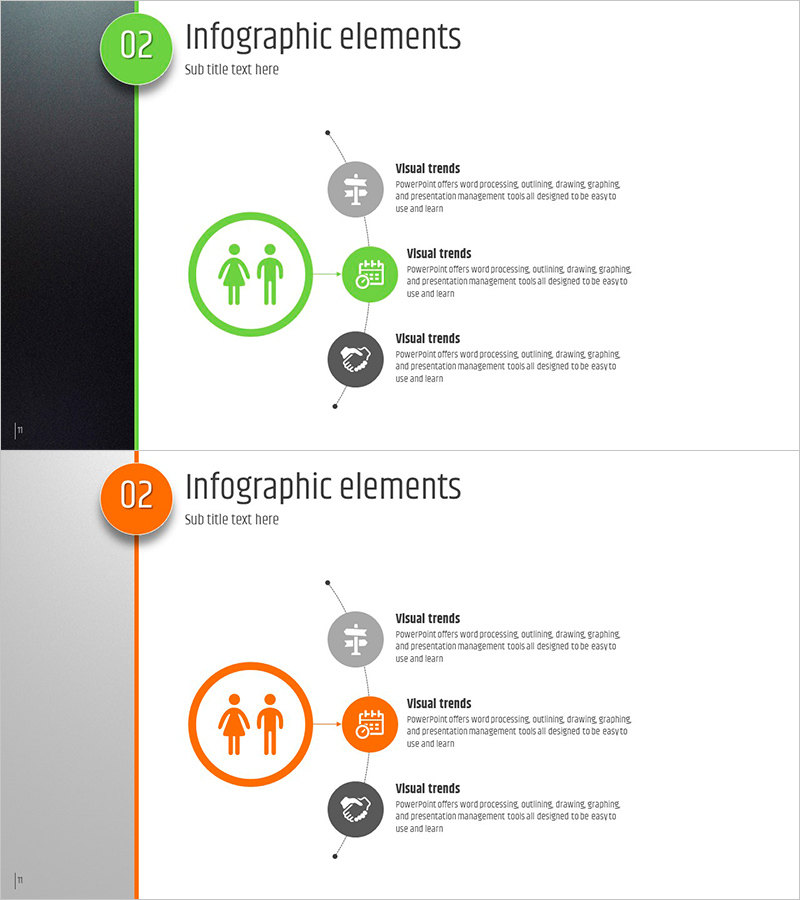
A radial infographic diagram PowerPoint slide featuring a central circular node with three directional branches extending outward. The design uses a two-tone color scheme of green and orange, with icons and text areas integrated into each node. This presentation template is ideal for product introductions, market analysis, and customer segmentation. The 2-slide deck is fully editable and optimized for 16:9 widescreen format, making it ready for immediate use in business presentations.
Usage Points
-
Main Usage
Visualize core elements such as product features, market positioning, or customer segments using a radial structure that extends from a central node in three directions. Each node contains dedicated icon and text areas for clear information hierarchy. The design allows sequential emphasis of each node during presentation flow.
-
How to Use
Enter your main topic in the central circular node, then populate the three surrounding nodes (top-left, top-right, and bottom) with supporting details. Customize the icons in each node to match your content, and add descriptive text in the designated areas. The three-color palette (green, orange, gray) can be adjusted to emphasize different hierarchy levels.
-
Recommended For
Recommended for product management, marketing, and sales teams presenting to executives, clients, or internal stakeholders. Particularly effective for communicating product value propositions, market positioning strategies, customer segmentation analysis, and competitive differentiation. Suitable for board presentations, client pitches, and strategic planning meetings.
-
Slide Structure
2-slide deck with green-themed radial diagram on slide 1 and orange-themed radial diagram on slide 2. Each slide features a central node (approximately 120px diameter) connected to three outer nodes (approximately 80px diameter each) via connecting lines and directional arrows, creating a clear hierarchical relationship.
Related Products
-

Characteristic Diagram by Growth Process – Customer Analysis and Service Introduction
#Product/Service Introduction #Market and Competitor Analysis #Diagram
-

Presentation Slides on the Elderly Living Alone – Customer Analysis and Market Overview
#Product/Service Introduction #Market and Competitor Analysis #Diagram
-

Mobile System Characteristics Configuration Diagram – Visualization of Service Operation Plans
#Product/Service Introduction #Business Management #Technical Approach
-

Analysis Before and After Diet – Change and Achievement
#Product/Service Introduction #Market and Competitor Analysis #Graph
