Business Strategy Visual Slide Template Using Doughnut Chart – Emphasizing Market Share
RJ0200008_8
- Last Update 03/30/2025
- File Size 3.4MB
- # of Slides 2
- File Format PPTX
- Slide Ratio 16:9
- Color
Keywords
- #Content-Based Slides
- #Design-Based Slides
- #Business Vision and Strategy
- #Market and Competitor Analysis
- #Graph
- #Business Goals
- #Market Share
- #Circles
- #Doughnut Chart
- #16:9
- #doughnut chart PowerPoint
- #pie chart slide template
- #ratio comparison graph
- #market share visualization
- #business presentation slides
- #percentage data chart
About the Product
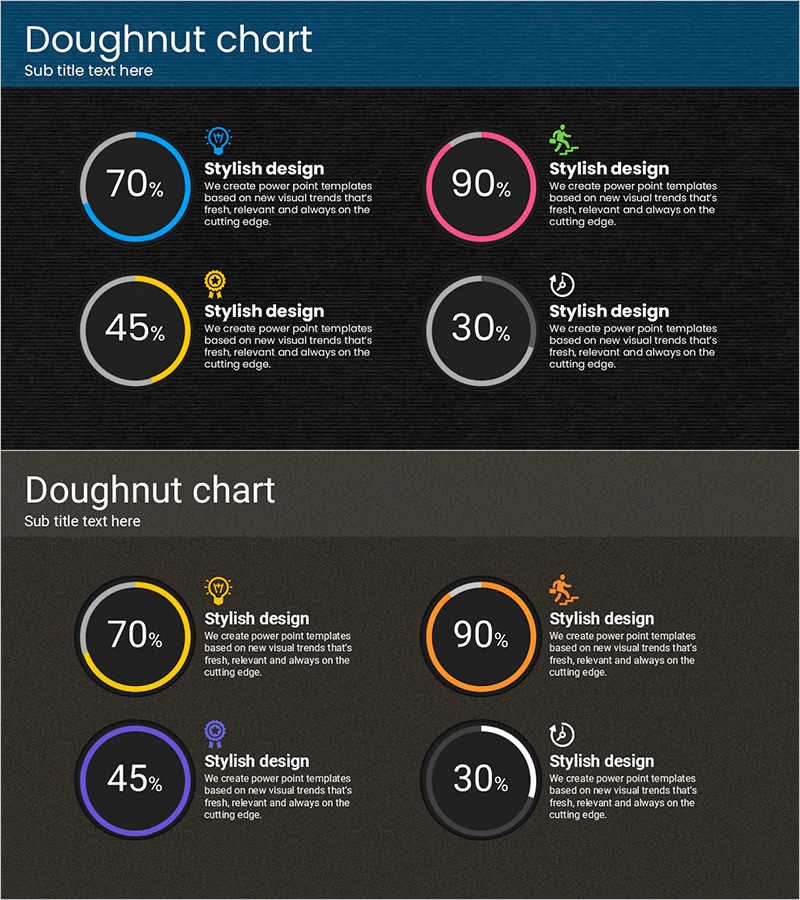
A professional doughnut chart PowerPoint slide template optimized for market share, business vision, and strategic planning presentations. The 2-slide set features a dark background with four doughnut-shaped pie charts in blue, pink, yellow, and gray on the first slide, each displaying percentage values at the center. The second slide maintains the same layout with alternative colors—yellow, orange, purple, and white—for flexible presentation contexts. Each chart includes a centered percentage figure and right-aligned icon with descriptive text, maximizing data readability. Delivered in 16:9 widescreen PPTX format, fully editable with customizable colors and values for immediate use.
Usage Points
-
Main Usage
Visualizes the proportional relationship between four key metrics such as market share, business vision, strategic initiatives, and performance outcomes. The doughnut format leverages the central space to emphasize critical figures or titles, enhancing data credibility in business presentations.
-
How to Use
Ideal for executive briefings, business strategy presentations, marketing analysis sessions, investor pitches, and quarterly performance reviews. The high-contrast dark background ensures clarity on projectors, making percentage values and data points distinctly visible to audiences.
-
Recommended For
Executives, business strategists, marketing professionals, financial analysts, consultants, and sales leaders who drive decisions based on quantitative data. Particularly effective for market analysis, competitive benchmarking, and resource allocation discussions.
-
Slide Structure
2-slide composition. Slide 1: Dark background with four doughnut charts in blue, pink, yellow, and gray; centered percentages (70%, 90%, 45%, 30%); right-aligned icons and descriptive text. Slide 2: Identical layout with alternative colors (yellow, orange, purple, white). 16:9 widescreen format, PPTX.
Related Products
-

Visualizing Educational Insights from Surveys with Doughnut Chart
#Market and Competitor Analysis #Diagram #Graph
-

Office Desk Donut Chart Analysis – Visualizing Market Share
#Market and Competitor Analysis #Graph #Market Status
-

Animals Nature Donut Chart Infographics – Market Share Analysis
#Market and Competitor Analysis #Graph #Market Share
-

Safety Template Donut Chart – Visualizing Performance and Management
#Company Introduction #Market and Competitor Analysis #Graph
