Office Desk Donut Chart Analysis – Visualizing Market Share
RB0100002_4
- Last Update 02/28/2025
- File Size 2.8MB
- # of Slides 2
- File Format PPTX
- Slide Ratio 4:3
- Color
Keywords
About the Product
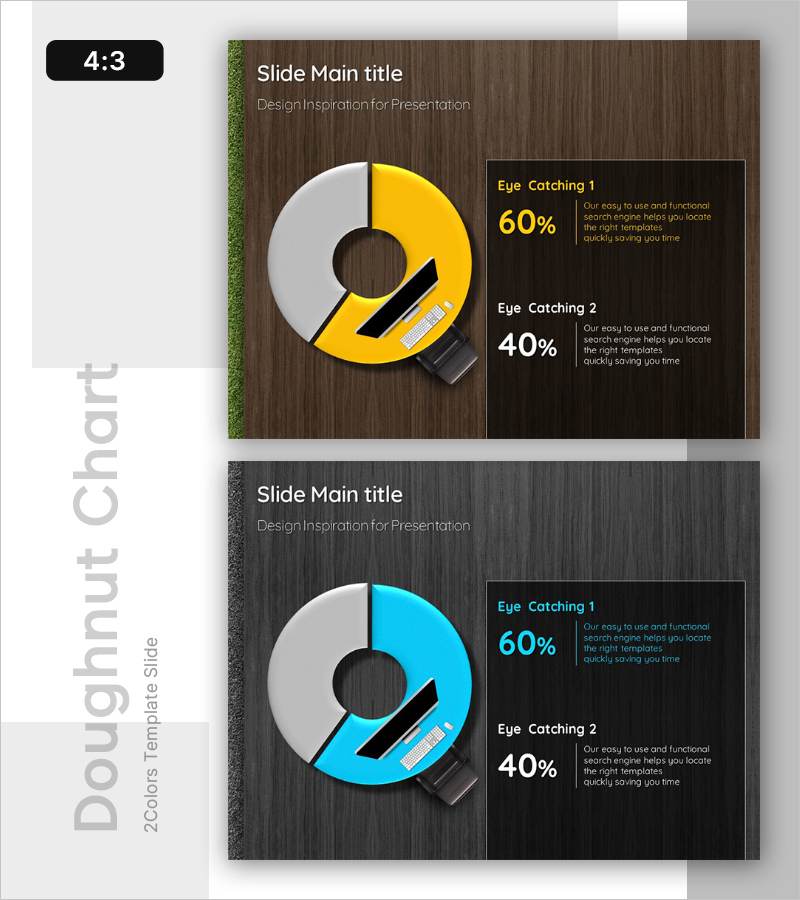
Professional donut chart PowerPoint slide featuring an office desk background design. This template displays two data series (60% and 40%) in yellow and gray colors, ideal for visualizing market share, sales ratios, customer satisfaction, and comparative analysis. The right panel includes a black background text box with golden-colored percentages and descriptive text, making it perfect for business presentations, analytical reports, and marketing decks. The 4:3 aspect ratio with 2-slide layout allows flexible data representation.
Usage Points
-
Main Usage
The donut chart effectively communicates the proportion of parts relative to the whole. Perfect for presenting market share, sales distribution, customer satisfaction scores, and brand awareness comparisons. The black background with golden-colored percentages draws audience attention to key data points.
-
How to Use
Use this slide in the analysis and results section of your presentation to explain data proportions. Suitable for marketing strategy documents, business performance reports, investor pitch decks, and quarterly results presentations. The 2-slide format allows you to present multiple data sets sequentially.
-
Recommended For
Marketing managers, sales directors, financial analysts, business executives, management consultants, and educators delivering data-driven presentations. Ideal for quarterly performance analysis, competitive comparisons, customer segmentation, and portfolio composition explanations.
-
Slide Structure
2-slide template with one donut chart per slide. Left side features a two-color donut graph (yellow and gray), while the right side contains a black background text box with two sections (Eye Catching 1 and 2) for entering percentages and descriptions. 4:3 aspect ratio ensures compatibility with standard projectors and monitors.
Related Products
-

Management System Donut Chart Slide – Market Share and Status
#Market and Competitor Analysis #Graph #Market Status
-

Pie Chart for Decimal Ratio Analysis – Market Share Status
#Market and Competitor Analysis #Graph #Market Status
-

Distribution Graph of Food Materials – Market Status Chart
#Market and Competitor Analysis #Graph #Other
-

Logistics Market Share Chart – Current Status and Competitive Analysis
#Market and Competitor Analysis #Graph #Market Status
