Touch Wide Diagram using Service Composition – Innovative Flow
RJ0200008_33
- Last Update 03/30/2025
- File Size 3.4MB
- # of Slides 2
- File Format PPTX
- Slide Ratio 16:9
- Color
Keywords
- #Content-Based Slides
- #Design-Based Slides
- #Technical Approach
- #Diagram
- #Service Architecture Diagram
- #Innovative Technologies and Future Plans
- #Flow
- #Spread
- #Centralized Diagram
- #16:9
- #radial diagram PowerPoint
- #central hub slide template
- #5-node flow diagram
- #service composition PowerPoint
- #diagram slide design
- #how to create radial diagram in PowerPoint
About the Product
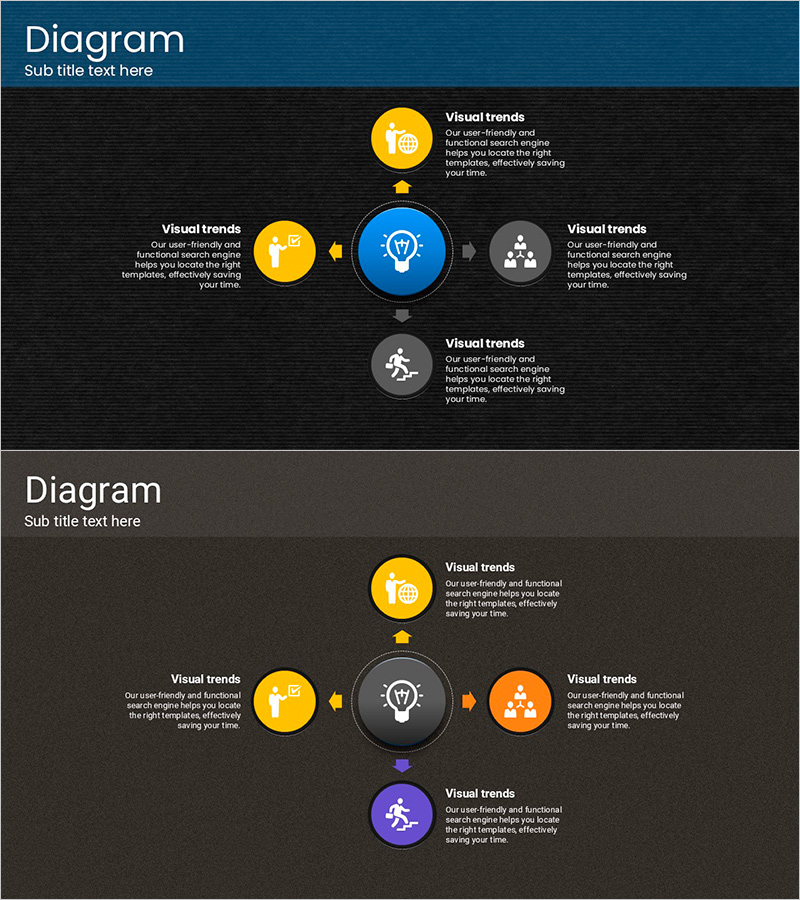
A PowerPoint slide featuring a radial diagram structure with a central blue node connected to five satellite nodes (yellow, gray, orange, purple) arranged in a circular pattern. This design effectively visualizes service composition, technology innovation, organizational roles, and process flows. Set against a dark background (black and charcoal), the colorful circular icons and directional arrows create a clear information hierarchy. Each node includes dedicated text areas for detailed descriptions, making it ideal for business presentations, product introductions, and strategic communications. The 2-slide set is ready to use and fully editable.
Usage Points
-
Main Usage
Communicate organizational structures, service compositions, technology ecosystems, process workflows, and role distributions using a central concept with radiating elements. The radial layout simultaneously conveys hierarchical relationships and interconnections, making complex systems easy to understand at a glance.
-
How to Use
Place your core concept (service name, technology, organization) in the central blue node. Add specific details (functions, roles, stages, characteristics) to each of the five satellite nodes. Customize icons and colors to match your brand identity. Use in company introductions, product demos, technology explanations, and organizational structure presentations.
-
Recommended For
Technology companies explaining product architecture, consulting firms presenting service portfolios, startups describing business models, educational institutions outlining learning pathways, and government agencies illustrating policy implementation frameworks.
-
Slide Structure
2-slide set. First slide: blue central node radiating to 5 satellite nodes (yellow, gray, orange, purple) on dark background. Second slide: identical structure with tonal background variation. Each node combines a circular icon with text area; directional arrows connect center to satellites, establishing clear information flow and visual hierarchy.
Related Products
-

Onion Circulation Diffusion Diagram – Technical Section and Service Structure
#Product/Service Introduction #Technical Approach #Diagram
-

Big Data Development Field Diagram
#Business Introduction #Technical Approach #Diagram
-

Advances in Science by Year Slide
#Technical Approach #Diagram #Future Development Roadmap
-

Content Order Description Diagram – Innovative Technology and Future Plans
#Product/Service Introduction #Technical Approach #Diagram
