Onion Circulation Diffusion Diagram – Technical Section and Service Structure
RJ0600046_18
- Last Update 07/03/2025
- File Size 0.6MB
- # of Slides 2
- File Format PPTX
- Slide Ratio 16:9
- Color
Keywords
- #Content-Based Slides
- #Design-Based Slides
- #Product/Service Introduction
- #Technical Approach
- #Diagram
- #Benefits and Advantages
- #Service Architecture Diagram
- #Flow
- #Spread
- #Circular Flow
- #Centralized Diagram
- #16:9
- #onion diagram PowerPoint
- #radial circulation diagram slide
- #6-node structure template
- #central concept diagram
- #service architecture PowerPoint slide
About the Product
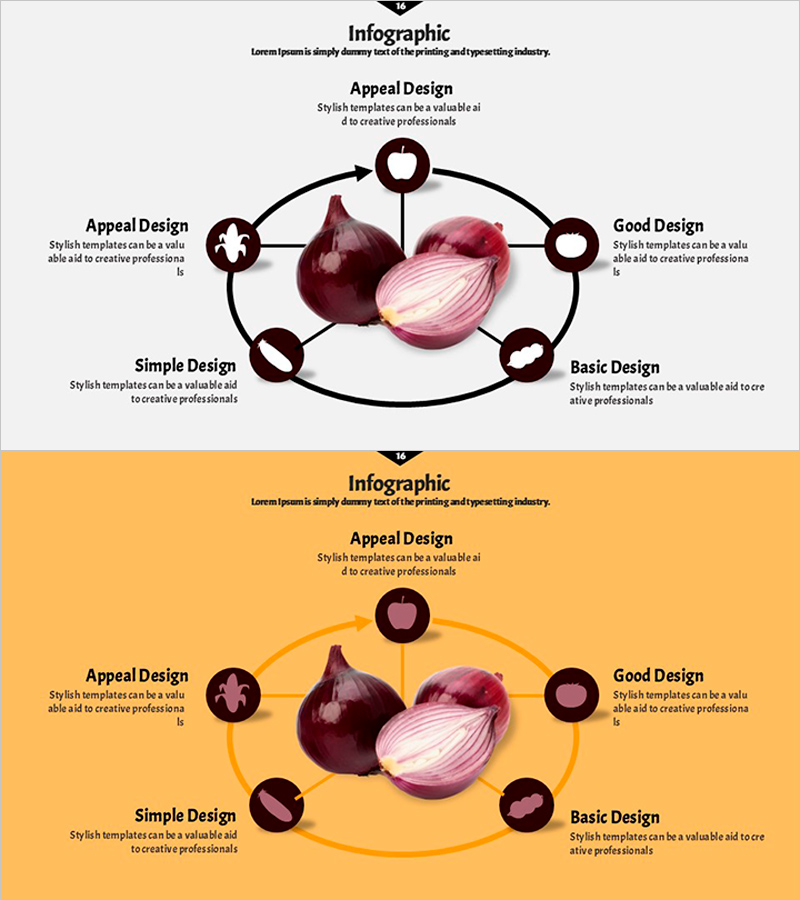
A radial circulation diagram PowerPoint slide with six nodes arranged around a central onion image, ideal for visualizing hierarchical and distributed information structures. The design uses black arrows and circular nodes to clearly show connections between a central concept and surrounding elements, making it perfect for technical architecture, service composition, and organizational structure presentations. This 16:9 widescreen slide set includes two layouts: one with a white background and black nodes, and another with a warm orange background and burgundy nodes. Each node is fully editable, allowing you to customize text and adapt the diagram for business plans, technology overviews, service frameworks, and strategic communications.
Usage Points
-
Main Usage
This diagram excels at illustrating how a central concept or product connects to multiple surrounding elements or functions. It's particularly effective for explaining system architectures where a core module interacts with peripheral systems, service ecosystems where a main offering branches into supporting features, and organizational structures where a central function coordinates with multiple departments.
-
How to Use
The central onion image represents your core concept, product, or organization. Click on each of the six surrounding nodes to add relevant information or supporting elements. Customize node colors, arrow styles, and text formatting to match your brand guidelines. Switch between the white and orange background versions depending on your presentation context and visual hierarchy needs.
-
Recommended For
Technology teams explaining system architecture and module relationships, product managers presenting service composition and feature ecosystems, executives communicating organizational structure and departmental roles, marketing professionals mapping customer touchpoints and journey stages, consultants illustrating business models and value chain analysis.
-
Slide Structure
Two-slide set with identical 6-node radial layouts: Slide 1 features a white background with black circular nodes and connecting arrows; Slide 2 uses a warm orange background with burgundy nodes. Both maintain the same central onion image and radial arrangement, with editable text areas positioned around each node for flexible content input.
Related Products
-

Experimental Introduction Diagram - Efficient Process Explanation
#Company Introduction #Product/Service Introduction #Diagram
-

Service Area Diagram – Visualizing Business Model Composition
#Company Introduction #Technical Approach #Diagram
-

Service Structure and Benefits Explanation – Communicating Business Value
#Technical Approach #Diagram #Service Architecture Diagram
-

Environmental and Social Contribution Activities – Flow Diagram
#Corporate Social Responsibility #Diagram #Environmental Protection Efforts
