Weather Mechanism Diagram – Climate Change and Sustainability
RB0500009_5
- Last Update 03/13/2025
- File Size 4.6MB
- # of Slides 2
- File Format PPTX
- Slide Ratio 4:3
- Color
Keywords
- #Content-Based Slides
- #Design-Based Slides
- #Technical Approach
- #Corporate Social Responsibility
- #Diagram
- #System Architecture Diagram
- #Sustainability Programs
- #Flow
- #Spread
- #Circular Flow
- #Centralized Diagram
- #4:3
- #radial diagram PowerPoint slide
- #circular flow diagram template
- #8-node process diagram
- #sustainability presentation slide
- #how to create circular diagram in PowerPoint
About the Product
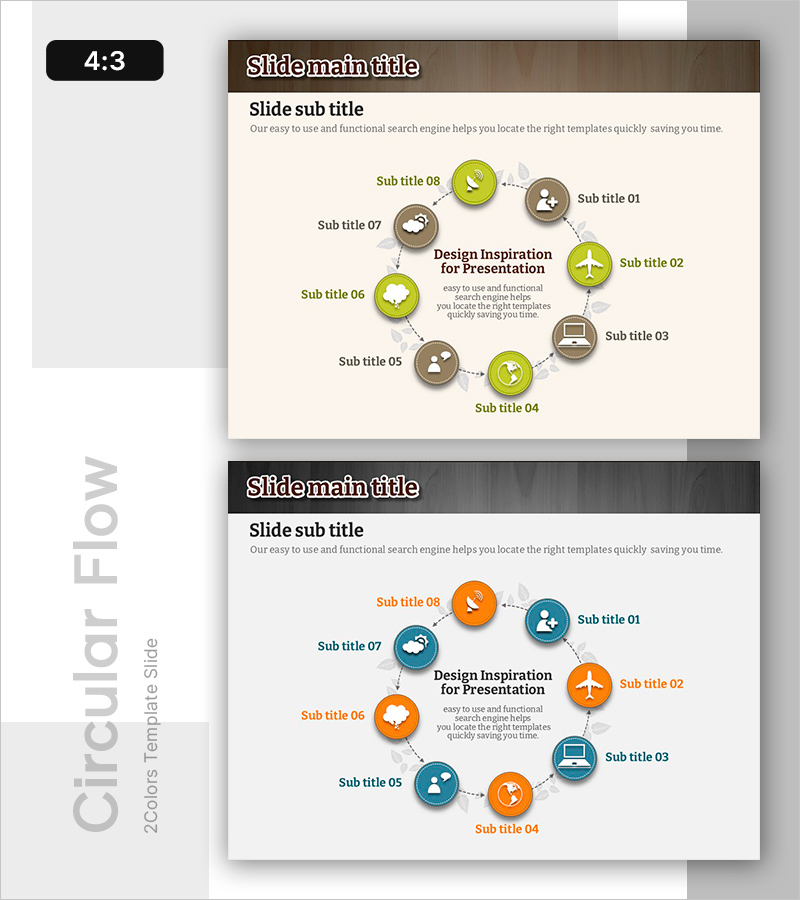
A radial circular diagram PowerPoint slide featuring 8 nodes arranged around a central topic with flowing connections. The design uses green and brown circular icons connected by dotted arrow lines, allowing text and icons to be placed at each node. This versatile slide template works for climate change presentations, sustainability initiatives, process flows, organizational structures, and cycle explanations. The 4:3 aspect ratio 2-slide set is ready to edit and customize for your presentation needs.
Usage Points
-
Main Usage
Visualizes how peripheral elements flow around a central concept in a circular pattern. Ideal for explaining process stages, organizational roles, cyclical relationships, and multi-faceted perspectives. Effectively communicates cause-and-effect, interconnections, and holistic approaches in climate, sustainability, and corporate responsibility topics.
-
How to Use
Enter your core topic in the center circle, then populate the 8 surrounding nodes with key details. Edit the icons and text labels to match your presentation content. Dotted arrows show relationships between nodes and can be added or removed as needed for your narrative.
-
Recommended For
Environmental and sustainability reports, climate change education materials, organizational structure and role descriptions, business process flowcharts, marketing campaign strategy phases, project management cycles, policy development and implementation timelines, and stakeholder engagement frameworks.
-
Slide Structure
Central circular text box (core topic) + 8 circular nodes (alternating green and brown) + dotted arrow connectors (inter-node relationships) + text labels (node descriptions). Delivered as a 4:3 aspect ratio 2-slide set.
Related Products
-

Environmental and Social Contribution Activities – Flow Diagram
#Corporate Social Responsibility #Diagram #Environmental Protection Efforts
-

Business Process Pentagon 3D Diagram – Visualizing Operational Plans
#Operational Plan #Technical Approach #Diagram
-

Green Life Practice Diagram - Sustainable Environment and Responsibility
#Corporate Social Responsibility #Diagram #Environmental Protection Efforts
-

Sleek Diagrams for Future Plans – Stylish Design
#Technical Approach #Diagram #System Architecture Diagram
