Wide Line Chart PowerPoint Template for Global Business – Marketing Strategy Development
RJ0200004_11
- Last Update 03/29/2025
- File Size 1MB
- # of Slides 2
- File Format PPTX
- Slide Ratio 16:9
- Color
Keywords
- #Content-Based Slides
- #Design-Based Slides
- #Marketing Plan and Strategy
- #Graph
- #Marketing Objectives
- #Target Market Strategy
- #Line
- #Line Chart
- #16:9
- #line chart PowerPoint
- #trend data visualization slide
- #time series chart template
- #marketing analytics graph
- #business performance PowerPoint
- #how to create line chart in PowerPoint
About the Product
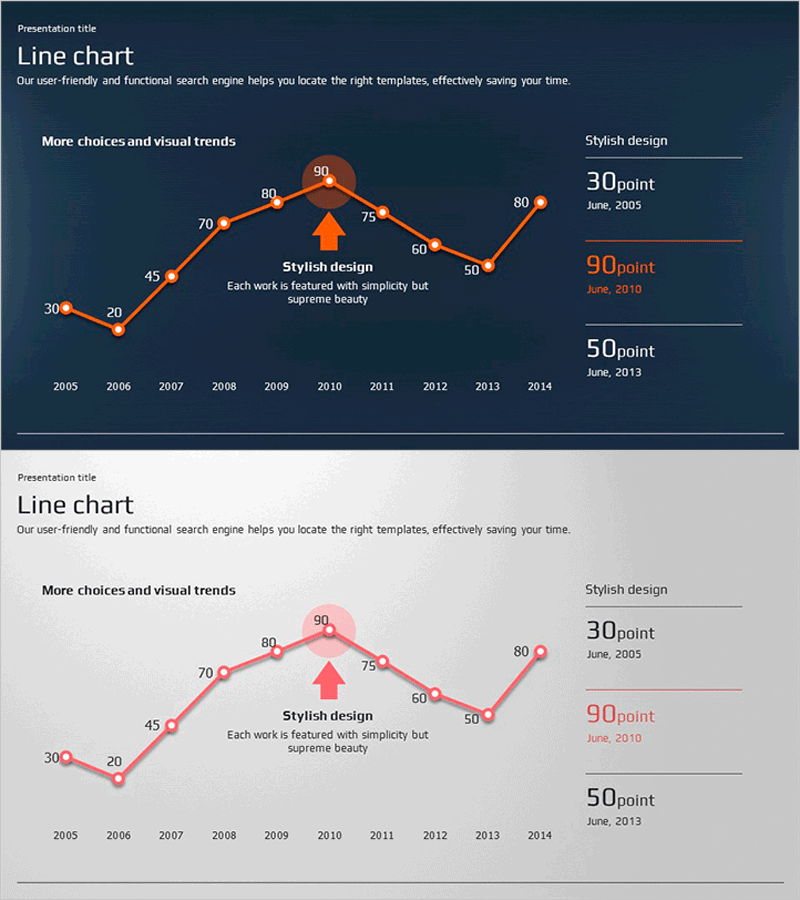
A line chart PowerPoint slide that visualizes long-term trends from 2005 to 2014 with orange-toned lines and circular data points. The design clearly shows changes over time, with a right-side panel for highlighting key metric values. Perfect for presenting marketing performance analysis, sales trends, customer satisfaction changes, and other business indicators in your presentation. Delivered in 16:9 widescreen format with 2 slides in fully editable PPTX format.
Usage Points
-
Main Usage
Effectively communicate numerical changes and trends over time with this optimized slide template. Display year-over-year performance metrics, market share evolution, customer growth trends, and other longitudinal data analysis in an intuitive visual format.
-
How to Use
Input your actual data into the left-side line chart and update the right-side metric values with key points such as peak value, lowest value, and current value. Enhance audience engagement by using slide animations to reveal data points sequentially during your presentation.
-
Recommended For
Ideal for marketing strategy presentations, quarterly performance reports, sales analysis, customer satisfaction survey results, and market trend analysis. Suitable for executive briefings, investor presentations, and team meeting materials.
-
Slide Structure
2-slide set. Slide 1: Line chart with 10 data points spanning 2005–2014, right panel with 3 key metric value display areas. Slide 2: Identical layout in pink color scheme. Both slides include title and descriptive text areas for customization.
Related Products
-

Analysis of Travel Tourist Movement Patterns – Dynamic Marketing Use
#Marketing Plan and Strategy #Diagram #Other
-

Newspaper Wide PowerPoint Template Line Chart 2
#Market and Competitor Analysis #Marketing Plan and Strategy #Graph
-

Aerospace Industry Target Market Strategy – Innovation and Growth
#Marketing Plan and Strategy #Diagram #Other
-

Target Market Strategy for Energy Saving Slide
#Market and Competitor Analysis #Marketing Plan and Strategy #Graph
