Area Chart for Market and Competitive Analysis – Identity Presentation
RJ0200003_10
- Last Update 03/29/2025
- File Size 0.4MB
- # of Slides 2
- File Format PPTX
- Slide Ratio 16:9
- Color
Keywords
About the Product
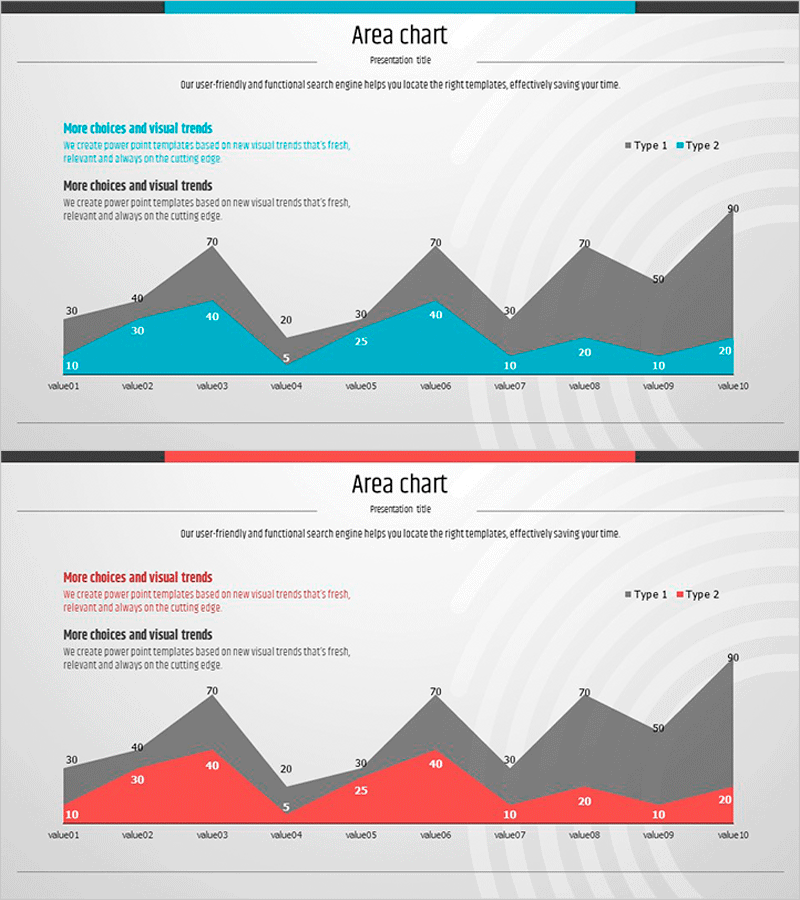
An area chart PowerPoint slide designed for market trend and competitive analysis presentations. This slide visualizes two data series in blue and gray, overlapping to show comparative changes across ten time periods. Each slide includes a title section, descriptive text area, legend, and axis labels, making it ready for immediate use in business presentations. The 16:9 widescreen format with two-slide composition supports data-driven decision-making in market analysis sections of pitch decks, investor reports, and strategic planning documents.
Usage Points
-
Main Usage
This slide visualizes market conditions and competitor performance across time periods using an area chart. The overlapping area representation intuitively conveys the difference in trends between two data series, serving as evidence-based support for market insights in investor presentations and executive reports.
-
How to Use
Place this slide in the market overview section of business plans, investor decks, or market analysis reports. Replace the sample data with your actual figures and edit the title and description text to match your presentation context. During presentation, you can highlight individual data points by hovering with your mouse.
-
Recommended For
Strategic planning teams, marketing departments, and finance teams use this slide when presenting market analysis results to executives, investors, and business partners. It is particularly valuable for presentations covering new market entry, competitive positioning, and market penetration strategies.
-
Slide Structure
Each slide consists of a title area at the top (one line), a central area chart with two-layer data visualization across ten time periods, and a descriptive text area at the bottom (two lines). Legend, axis labels, and numerical values are included, allowing the slide to be used in presentations without additional editing.
Related Products
-

Investment Competition Market Analysis Graph – Effective Market Evaluation
#Market and Competitor Analysis #Diagram #Graph
-

White Black Area Graph – Visualizing Market Analysis
#Market and Competitor Analysis #Graph #Other
-

Two Types of Area Graphs – Market and Competitor Analysis
#Market and Competitor Analysis #Graph #Other
-

Sales and Profit Growth Trend Analysis Graph – Market and Financial Performance
#Market and Competitor Analysis #Financial Plans and Performance #Graph
