Application PowerPoint Map Template – Business Introduction and Market Analysis
RJ0200001_6
- Last Update 03/28/2025
- File Size 0.4MB
- # of Slides 2
- File Format PPTX
- Slide Ratio 16:9
- Color
Keywords
About the Product
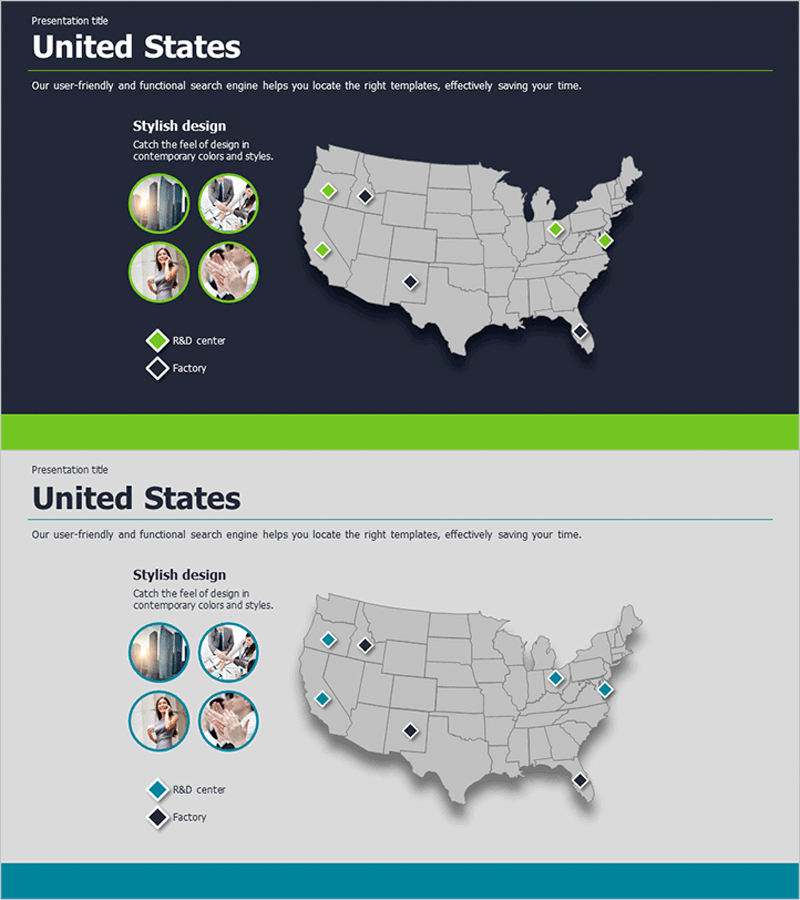
A professional United States map PowerPoint slide designed for business introduction and market analysis presentations. The dark navy background features teal and green point markers to clearly indicate R&D centers and factory locations across the country. The left side includes four circular image areas for showcasing each location's characteristics, with a legend to distinguish information hierarchy. This 16:9 ratio, 2-slide presentation template is ready to use in business pitch decks, company profile presentations, and investment materials.
Usage Points
-
Main Usage
Visualize global business locations and market distribution through an interactive map to effectively communicate your company's scale and regional strategy to investors, partners, and clients. Highlight R&D centers, factories, and sales offices across the United States using color-coded point markers to reinforce your organization's global network credibility.
-
How to Use
Slide 1 features a dark background map version, while Slide 2 provides a light gray background option. Customize the point marker colors (teal for R&D, black for factories) or add new locations as needed. Insert photos of each location into the four circular image areas on the left to enhance presentation impact and storytelling.
-
Recommended For
Ideal for multinational corporations, manufacturing companies, IT firms, and consulting organizations presenting to executives, investors, and stakeholders. Perfect for company introduction decks, investment pitch materials, business plans, and market analysis reports requiring geographic visualization.
-
Slide Structure
Each slide combines a left-side content area (title, descriptive text, and four circular image placeholders) with a right-side US map visualization. A legend distinguishes location types (teal diamond for R&D centers, black diamond for factories), with multiple point markers distributed across the map to support comparative and analytical presentations.
Related Products
-

Target Country Revenue Analysis - Including South Korea
#Company Introduction #Market and Competitor Analysis #Other
-

Asian Target Market Analysis Graph
#Market and Competitor Analysis #Graph #Other
-

Buttons Display Global Map – Sharing Market Insights
#Market and Competitor Analysis #Other #Target Market
-

Target Area Status Analysis Graph – Data and Insights
#Company Introduction #Market and Competitor Analysis #Graph
