Target Country Revenue Analysis - Including South Korea
RJ0300081_10
- Last Update 05/11/2025
- File Size 0.9MB
- # of Slides 2
- File Format PPTX
- Slide Ratio 16:9
- Color
Keywords
About the Product
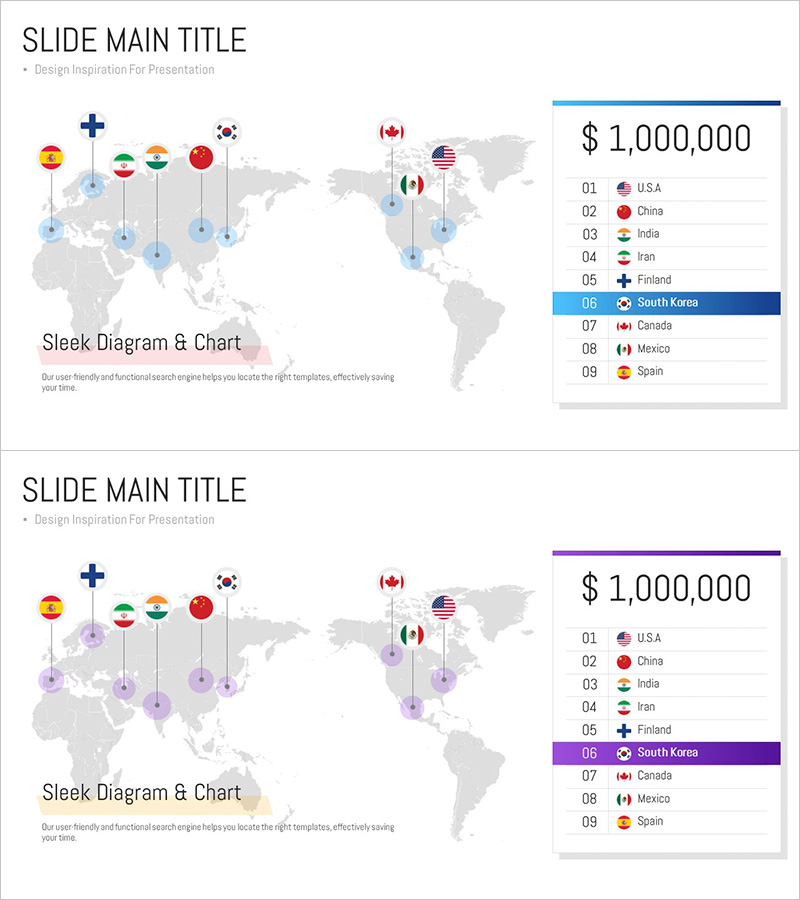
A map-based PowerPoint slide that visualizes country-by-country revenue at a glance. This 2-slide presentation features a world map with country flags and revenue figures, complemented by a ranked list on the right side. The blue accent color and gray background create a professional atmosphere, making it ideal for market analysis, global network presentations, and business strategy discussions. Text input areas and chart spaces are clearly separated for easy data modification, and the 16:9 widescreen format is optimized for modern projectors and online presentations.
Usage Points
-
Main Usage
This analytical slide expresses country-level revenue scale and ranking simultaneously on a global map. Flag icons on the world map and a ranked list on the right convey regional sales performance intuitively, enabling executives, investors, and partners to understand your global business position clearly.
-
How to Use
Enter your analysis title (e.g., 2024 Global Revenue Overview) in the header area and update country flags and revenue amounts on the map. Modify the country names, rankings, and figures in the right-side list to complete the slide. You can change colors to highlight specific regions or expand the slide by copying and repositioning flag icons for additional countries.
-
Recommended For
Ideal for investor relations materials, market analysis reports, business strategy presentations, international sales updates, and fundraising pitches. Particularly useful for executive briefings comparing multi-country revenue, partner collaboration proposals, and market entry strategy planning.
-
Slide Structure
The 2-slide set features a world map (70% left side), country flag icons positioned on the map, revenue amounts displayed above flags, and a ranked list of 6–9 countries on the right. The first slide uses blue accent color while the second uses purple, allowing for comparative analysis or time-period representation.
Related Products
-

Target Market Goal Map for Global Market Analysis
#Company Introduction #Market and Competitor Analysis #Other
-

Global Target Country Analysis – Strategic Market Insights
#Company Introduction #Market and Competitor Analysis #Diagram
-

Global Target Country Map – Essential Tool for Market Analysis
#Company Introduction #Market and Competitor Analysis #Other
-

Global Target Country Map – Market Entry Strategy
#Company Introduction #Market and Competitor Analysis #Other
