Doughnut Chart Presentation for Pet Store Competitor Analysis
RM0800009_10
- Last Update 03/01/2025
- File Size 10.2MB
- # of Slides 2
- File Format PPTX
- Slide Ratio 16:9
- Color
Keywords
- #Content-Based Slides
- #Design-Based Slides
- #Market and Competitor Analysis
- #Graph
- #Competitor Analysis
- #Competitive Advantage
- #Circles
- #Doughnut Chart
- #16:9
- #doughnut chart PowerPoint
- #pie chart slide template
- #competitor analysis presentation
- #market share visualization
- #pet store marketing PPT
- #ratio data chart
About the Product
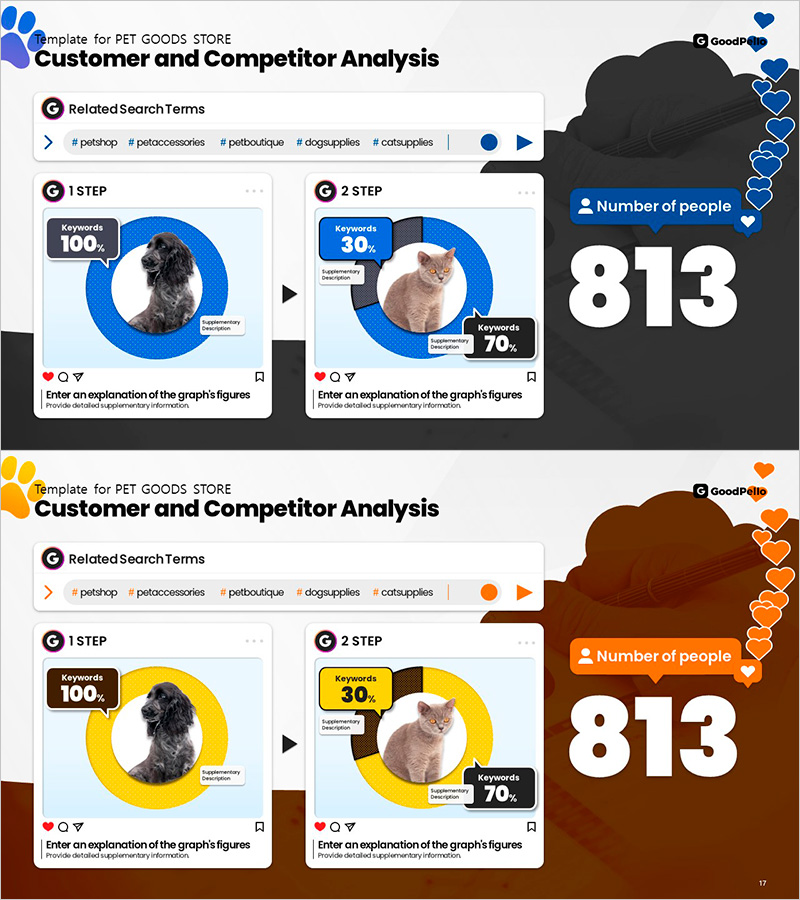
A 2-slide PowerPoint presentation featuring doughnut charts designed for pet store competitor analysis. Available in two color versions—blue and orange—each slide visualizes keyword distribution and market share data. The first slide displays 100% keyword concentration, while the second breaks down 30% top keywords versus 70% secondary keywords, utilizing the doughnut's center space to highlight key metrics or brand names. Covers pet shop, pet accessories, pet supplies, dog supplies, and cat supplies search term analysis. Delivered in 16:9 widescreen PPTX format, fully editable and ready to customize with your data.
Usage Points
-
Main Usage
Visualize pet industry market data—search term distribution, customer interest levels, and market share percentages—using doughnut charts to support competitive analysis and strategic decision-making in pet retail and e-commerce.
-
How to Use
Slide 1 shows overall market size (100%) in a single-segment doughnut. Slide 2 splits the market into top competitors (30%) and other players (70%) to illustrate market concentration. Insert key metrics or brand names in the doughnut's center to emphasize critical data points.
-
Recommended For
Pet shop owners, pet product marketing managers, animal supplies distributors, pet industry entrepreneurs, startup pitch decks, market research reports, and competitive landscape presentations.
-
Slide Structure
2-slide set. Slide 1: Single-segment doughnut chart (100% distribution) in blue or orange. Slide 2: Dual-segment doughnut chart (30%/70% split) in matching color. Both slides include text area below chart for data explanation and annotations.
Related Products
-

Global Logistics Competitor Chart
#Market and Competitor Analysis #Diagram #Graph
-

Current Status of Space Business Visualized with Donut Chart - Competitive Edge Analysis
#Market and Competitor Analysis #Graph #Competitor Analysis
-

Doughnut Chart Visualized with Leather Material – Highlighting Competitive Edge
#Market and Competitor Analysis #Graph #Competitor Analysis
-

Competitor Progress Comparison Analysis Graph – Essential Tool for Market Analysis
#Market and Competitor Analysis #Graph #Competitor Analysis
