Linear Diagram for Visualizing Business Progress – Second Key Step
RB0800070_9
- Last Update 03/27/2025
- File Size 0.1MB
- # of Slides 2
- File Format PPTX
- Slide Ratio 4:3
- Color
Keywords
About the Product
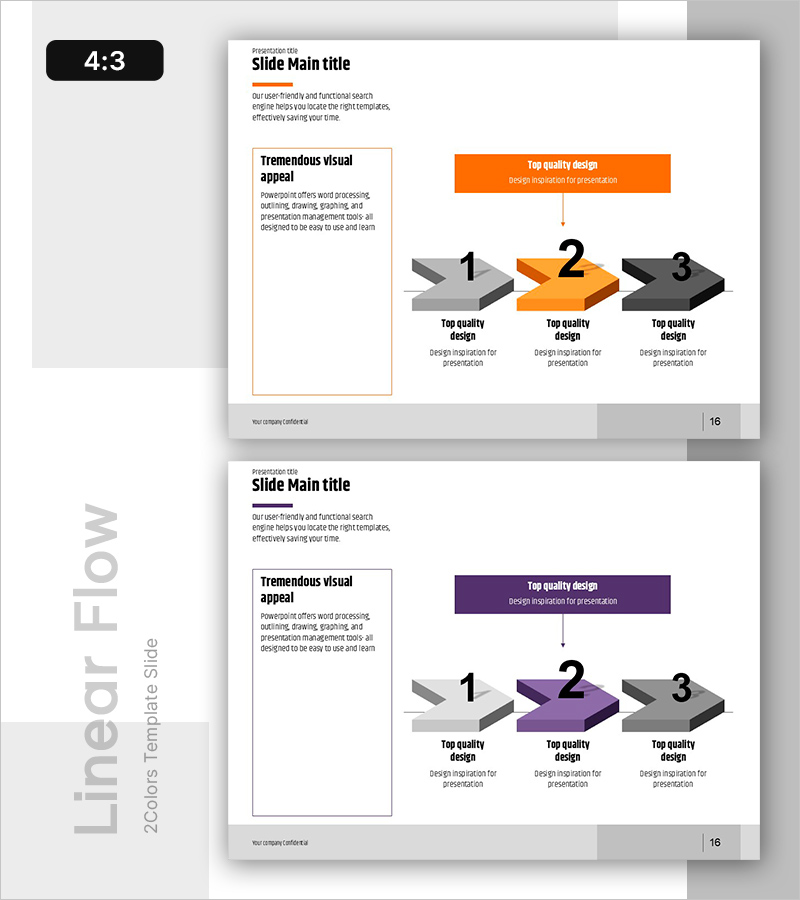
A linear diagram PowerPoint slide that clearly visualizes business progress through three sequential stages. The slide features three nodes connected by arrows in a straight-line flow structure, with editable text boxes for each stage's key information. The design uses orange accent color contrasted with gray and black tones to establish visual hierarchy. Presented in 4:3 aspect ratio across 2 slides, this presentation template is ready for immediate use in business reports. All elements—colors, text, and node count—are fully customizable in PowerPoint, making it ideal for business plans, project status updates, strategic execution phases, and various professional presentations.
Usage Points
-
Main Usage
Visualizes business progress across three sequential stages in chronological order. Each node accommodates stage names, objectives, and outcomes, while arrow connections emphasize linear progression. Ideal for executive briefings, investor presentations, and team meetings to communicate project status intuitively.
-
How to Use
Enter stage names (Stage 1, Stage 2, Stage 3) or time periods (quarters, months, years) in each node's text box. Add key activities, achievements, and responsible parties in the description area below each node. Colors are fully customizable via PowerPoint shape formatting, and nodes can be added or removed to extend to four or more stages.
-
Recommended For
Business plans, project status reports, strategic execution presentations, marketing campaign timelines, product development roadmaps, organizational restructuring announcements, and any professional presentation requiring stage-by-stage progress visualization.
-
Slide Structure
Slide 1: Title area + 3-node linear diagram with arrow connections + description text boxes for each node. Slide 2: Identical layout with color variation (purple accent). 4:3 aspect ratio, PPTX format, all elements fully editable.
Related Products
-

Strategic Directions for a Sustainable Business – Business Progress Flow
#Business Strategy #Diagram #Business Direction
-

Weather Flow Direction Diagram – Business Strategy Presentation
#Business Strategy #Diagram #Business Direction
-

Business Progress Stage Process Visualization - Progress and Direction
#Business Strategy #Diagram #Business Direction
-

Simple Propulsion Direction Diagram – Business Strategy
#Business Strategy #Diagram #Other
