Process Flow and Derivative Insight – Efficient Operational Planning Diagram
RB0800068_5
- Last Update 03/27/2025
- File Size 0.7MB
- # of Slides 2
- File Format PPTX
- Slide Ratio 4:3
- Color
Keywords
- #Content-Based Slides
- #Design-Based Slides
- #Operational Plan
- #Technical Approach
- #Diagram
- #Business Processes
- #Future Development Roadmap
- #Flow
- #Linear Flow
- #Multidirectional Flow
- #4:3
- #diagram PowerPoint slide
- #process flow presentation
- #3-step connected diagram
- #operational planning PowerPoint
- #insight visualization slide
About the Product
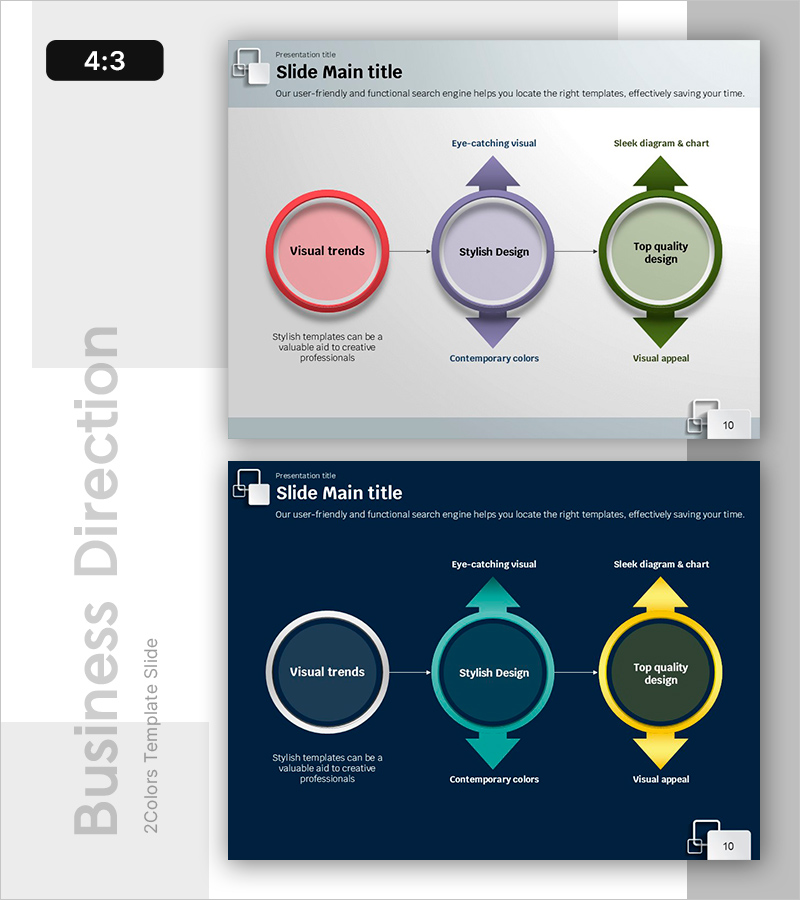
A 3-node connected diagram PowerPoint slide that visualizes process flow and derivative insights. Three circular nodes are linked by arrows, with triangle icons above each node emphasizing key concepts. Set against a light gray background, the nodes are color-coded in red, purple, and green to distinguish stages or interrelated strategic elements. This PowerPoint slide is ideal for operational planning, business strategy, and organizational improvement presentations where complex insights need to be communicated effectively.
Usage Points
-
Main Usage
This diagram expresses both process flow and interrelated insights simultaneously. Three circular nodes connected by arrows clearly visualize sequential progression or mutual influence relationships. Triangle icons above each node emphasize key concepts, while color differentiation distinguishes the characteristics of each stage.
-
How to Use
Use this slide in operational planning, business strategy, organizational improvement, and project management presentations to explain complex processes. Enter stage names, strategies, or objectives in each node, and add detailed explanations in the text areas below to enhance audience comprehension. Color coding and icons maximize visual emphasis.
-
Recommended For
Recommended for executives, strategy teams, operations teams, project managers, and consultants explaining complex processes and insights. Particularly suitable for management reports, strategy presentations, and organizational improvement proposals where multiple interrelated elements must be expressed simultaneously.
-
Slide Structure
Three circular nodes connected left to right by arrows. Each node is color-coded in red, purple, and green with triangle icons positioned above. Text input areas are embedded within each node, with description text space provided below. Comprises 2 slides in 4:3 aspect ratio.
Related Products
-

Visualizing Daily Work Processes – Effective Operational Planning
#Business Strategy #Operational Plan #Diagram
-

SNS Business Process – Visualization of Step-by-Step Planning
#Business Strategy #Operational Plan #Diagram
-

Design Work Process Diagram – Business Strategy
#Business Strategy #Operational Plan #Diagram
-

Business Process Diagram – Efficient Operational Planning
#Business Strategy #Operational Plan #Diagram
