Slide Visualizing Logistics and Transport Procedures
RJ0800029_28
- Last Update 08/08/2025
- File Size 0.3MB
- # of Slides 2
- File Format PPTX
- Slide Ratio 16:9
- Color
Keywords
- #Content-Based Slides
- #Design-Based Slides
- #Business Strategy
- #Operational Plan
- #Diagram
- #Step-by-Step Schedule Plan
- #Business Processes
- #Flow
- #Cluster
- #Linear Flow
- #Closed Cluster Diagram
- #16:9
- #logistics diagram PowerPoint
- #transport procedure slide
- #3-step process flow
- #supply chain visualization PPT
- #logistics flowchart PowerPoint template
About the Product
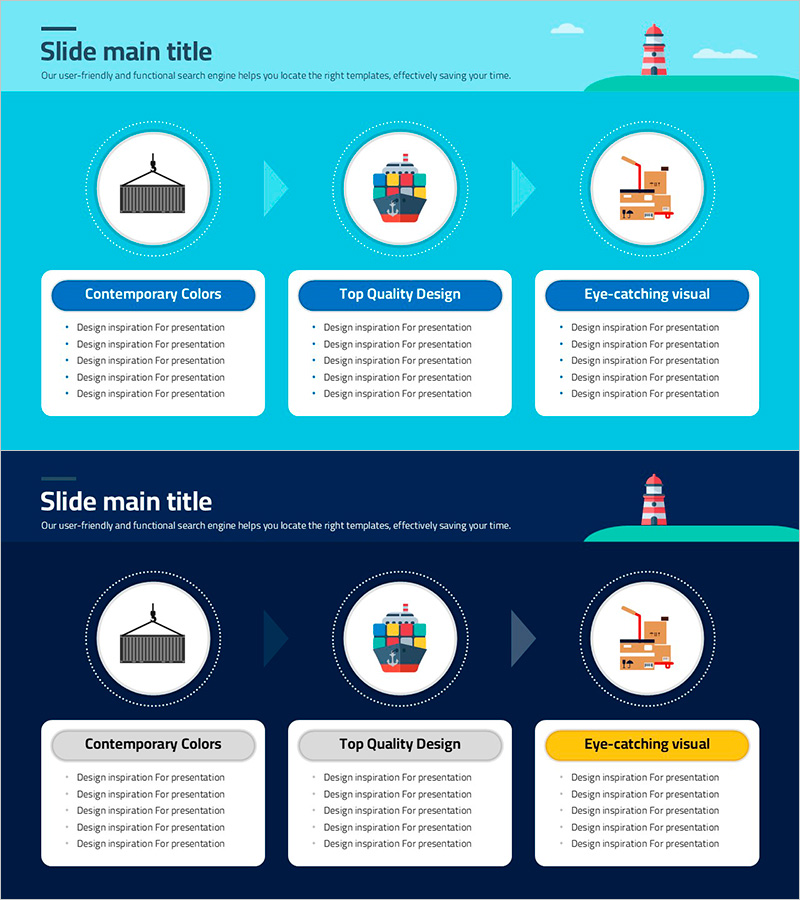
A PowerPoint slide that visualizes logistics and transport processes using a 3-node closed-loop diagram. Port, cargo ship, and warehouse icons are placed within circular nodes, with arrows indicating sequential flow. The design features a turquoise background, white circular nodes, and blue text boxes for descriptions. Two slide layouts are included—one with a bright turquoise tone and another with a dark navy background—allowing you to choose based on your presentation environment. Immediately applicable to business reports, proposals, supply chain presentations, and training materials for logistics and transportation sectors.
Usage Points
-
Main Usage
Clearly visualizes the sequential flow of logistics and transport processes to enhance audience comprehension. Port, cargo ship, and warehouse icons intuitively convey each stage's role, while the closed-loop diagram structure effectively represents cyclical or continuous processes.
-
How to Use
Use in business reports' operational overview sections, supply chain optimization proposals, logistics company introductions, and SCM training seminars. Edit node text to customize with your specific logistics stages (import, storage, distribution, etc.) for your organization.
-
Recommended For
Ideal for logistics and transportation professionals, supply chain managers, business development specialists, and training instructors explaining processes. Particularly useful for presentations on international trade, port operations, warehouse management, and shipping optimization.
-
Slide Structure
Two-slide set. Each slide features a 3-node closed-loop diagram with port, cargo ship, and warehouse icons connected by directional arrows. Description text boxes (blue background, white text) are positioned below each node. First slide has bright turquoise background; second slide features dark navy background for versatile presentation options.
Related Products
-

Business Processes for Service Development - Visualizing Workflow
#Company Introduction #Business Strategy #Operational Plan
-

Step-by-step Introduction Page – Business Strategy and Operational Planning
#Business Strategy #Operational Plan #Diagram
-

The Key Role of Step Two in Our Direction – Strategic Guidance
#Business Strategy #Operational Plan #Diagram
-

Financial Business Process Diagram – Roadmap for Efficient Operations
#Business Strategy #Operational Plan #Diagram
