Unlocking Insights with 3D Cubes – Cluster Diagram for Effective Information Delivery
RB0800060_4
- Last Update 03/27/2025
- File Size 0.2MB
- # of Slides 2
- File Format PPTX
- Slide Ratio 4:3
- Color
Keywords
- #Content-Based Slides
- #Design-Based Slides
- #Product/Service Introduction
- #Diagram
- #Features
- #Composition
- #Cluster
- #Spread
- #Closed Cluster Diagram
- #Decentralized Diagram
- #4:3
- #3D cube cluster diagram PowerPoint
- #information structure slide template
- #business presentation diagram
- #concept relationship chart
- #how to create cluster diagram in PowerPoint
About the Product
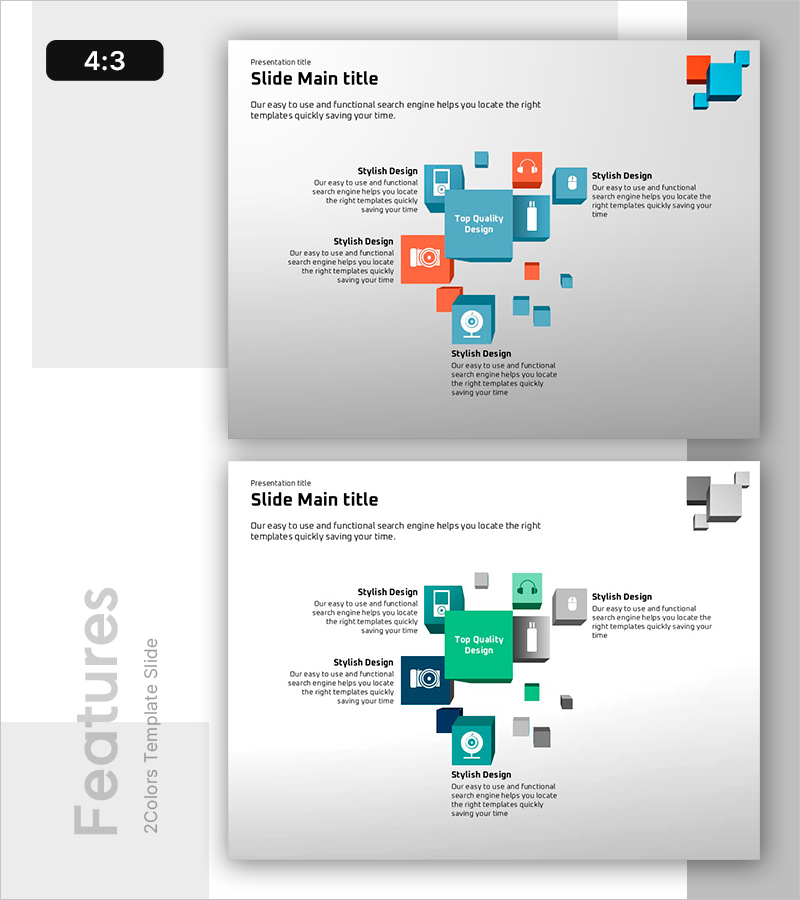
A PowerPoint slide featuring a 3D cube-based cluster diagram that transforms complex information into clear visual structures. The two-tone color scheme of orange and blue distinctly separates each element, while integrated icons and text boxes intuitively convey relationships between concepts. Ideal for business presentations, product introductions, and strategic planning sessions where information hierarchy and relational mapping are essential. This presentation slide effectively visualizes interconnected data and conceptual frameworks. Available in 4:3 aspect ratio with 2 slides ready for immediate use.
Usage Points
-
Main Usage
Transforms intricate information and conceptual relationships into a 3D cube visualization that enhances audience comprehension. Hierarchically arranges core concepts and supporting elements with icon emphasis to maximize information delivery clarity.
-
How to Use
Apply to product feature presentations by organizing functions, characteristics, and benefits into cluster formations, or use in business strategy presentations to represent key elements and related components. Customize text and icons to match diverse presentation topics and industry contexts.
-
Recommended For
Marketing professionals, product managers, executives preparing reports, educators, consultants, and business analysts who require information structuring and visual persuasion in presentations.
-
Slide Structure
Two-slide composition with the first slide displaying eight orange and blue cube elements arranged radially around a central hub, each containing icon and text areas. The second slide provides color variations (gray, green, navy tones) to accommodate different presentation contexts and branding requirements.
Related Products
-

Diagram of Major Course Listings – Emphasizing Educational Value
#Product/Service Introduction #Diagram #Features
-

Presentation Design Inspiration Slide Template
#Product/Service Introduction #Features #Composition
-

Body Organ Disease Analysis Diagram – Clear Information Delivery
#Product/Service Introduction #Diagram #Other
-

Tool Product/Service Overview Template – Stylish Cluster Design
#Product/Service Introduction #Diagram #Features
