Business Standard Table – Clear Visualization of Financial Performance
RB0800042_5
- Last Update 03/25/2025
- File Size 0.2MB
- # of Slides 2
- File Format PPTX
- Slide Ratio 4:3
- Color
Keywords
- #Content-Based Slides
- #Design-Based Slides
- #Financial Plans and Performance
- #Diagram
- #Sales and Revenue
- #Key Financial Indicators
- #Table
- #Standard Table
- #4:3
- #financial data table PowerPoint
- #data table slide template
- #4-column table design
- #financial performance visualization
- #business table PPT slide
About the Product
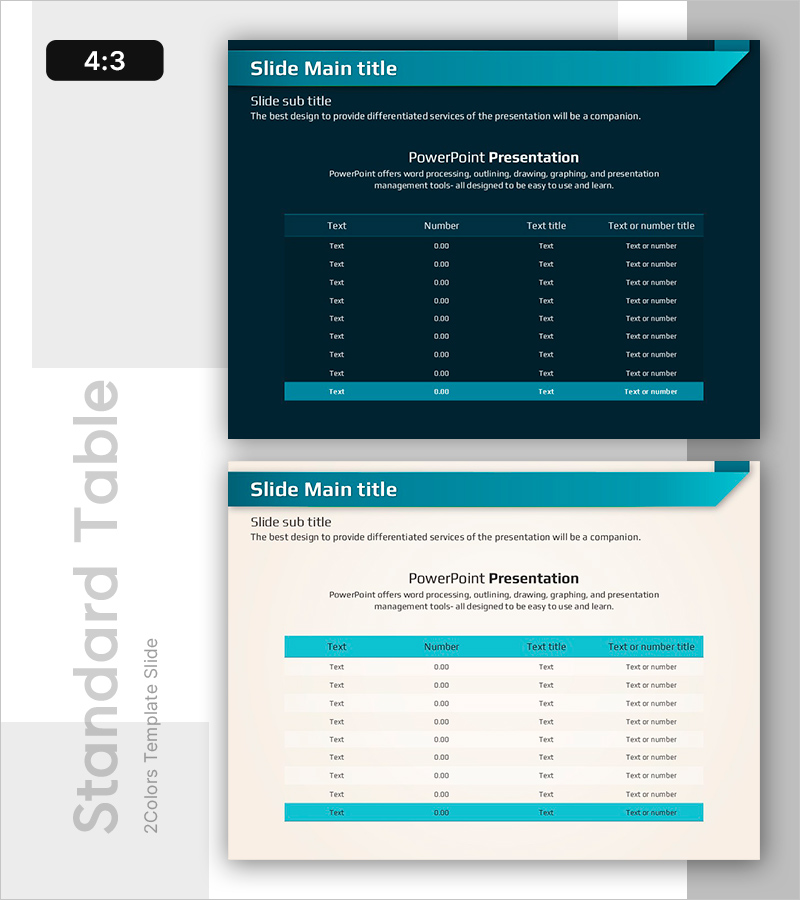
A 4-column table PowerPoint slide designed to clearly present financial performance and key metrics. Featuring a dark navy background with turquoise header accents in business standard design, it organizes text, numbers, titles, and numerical values systematically. The 2-slide set includes a dark version and light beige version, allowing you to choose based on presentation context. Optimized for comparing and analyzing quantitative data such as revenue, profit, and key financial indicators in professional presentations and reports.
Usage Points
-
Main Usage
Systematically arrange and compare quantitative data such as financial performance, key metrics, and revenue figures. The 4-column structure simultaneously displays item names, numerical values, titles, and descriptions, making complex financial information clear and easy to understand.
-
How to Use
Use the dark blue background version for investor presentations and executive reports to convey a premium atmosphere. Apply the light beige version for internal meetings and training materials. Simply edit the header row text and input actual data into the data rows for immediate use.
-
Recommended For
CFOs, finance teams, executives, and investor relations teams preparing quarterly earnings reports, annual financial analyses, and investment pitch decks. Also suitable for the financial section of business plans and marketing proposals, displaying budgets, revenue forecasts, and ROI comparisons.
-
Slide Structure
2-slide set: Title area (Slide Main title, Slide sub title, descriptive text) + central 4-column table (headers: Text, Number, Text title, Text or number title + 8 data rows + highlighted footer row). Dark version features dark navy background with turquoise header; light version uses beige background with turquoise header—identical structure with color variation only.
Related Products
-

Farm Key Financial Indicators Table Chart – Intuitive Presentation of Financial Performance
#Financial Plans and Performance #Diagram #Sales and Revenue
-

Minimal Block Table for Revenue and Profit Analysis – Emphasizing Financial Performance
#Financial Plans and Performance #Diagram #Sales and Revenue
-

Sales and Profit Table – Statistical Financial Performance
#Financial Plans and Performance #Diagram #Sales and Revenue
-

Visualizing Key Financial Indicators with Diagram Presentation
#Financial Plans and Performance #Diagram #Sales and Revenue
