Red Financial Growth Bar Graph – Enhancing Business Performance
RB0800041-1_5
- Last Update 03/25/2025
- File Size 2MB
- # of Slides 2
- File Format PPTX
- Slide Ratio 4:3
- Color
Keywords
- #Content-Based Slides
- #Design-Based Slides
- #Business Strategy
- #Financial Plans and Performance
- #Graph
- #Achievements
- #Sales and Revenue
- #4:3
- #sales growth bar chart PowerPoint
- #financial data presentation slide
- #10-step horizontal bar graph
- #business performance report slide
- #revenue trend visualization PPT
About the Product
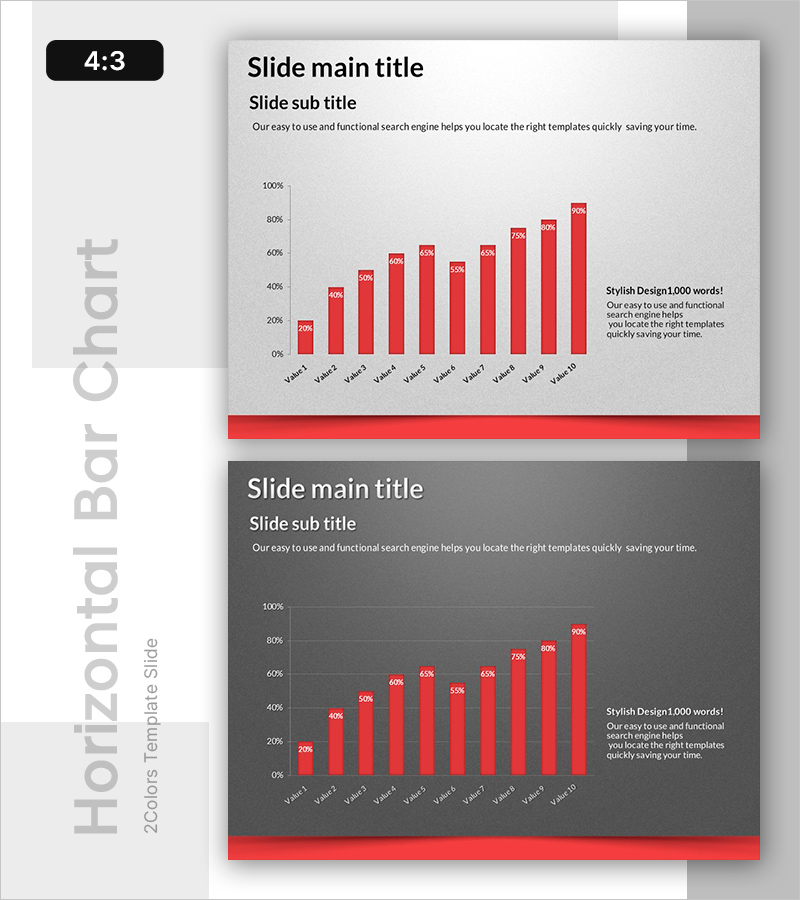
A 10-step horizontal bar chart PowerPoint slide designed to visualize financial performance and revenue trends. The layout features a light gray background with red-toned bars that emphasize upward data progression, clearly separated into a left text area and right chart area. Percentage values are displayed above each bar for precise data communication, while a description box in the lower right allows for additional insights. This slide is ready to use for business performance reports, financial planning presentations, investor briefings, and various corporate presentations requiring revenue visualization.
Usage Points
-
Main Usage
Communicate quarterly or annual revenue changes, compare business unit performance, and display investment return trends through intuitive bar graph visualization. Percentage indicators enable easy relative performance comparison while maximizing financial readability for executive audiences.
-
How to Use
Enter your presentation topic (e.g., Q1-Q4 2024 Revenue Overview) in the left title and subtitle areas. Modify each bar height and percentage value to match your actual data. Add key insights or achievement metrics in the lower right text box to support data interpretation and business conclusions.
-
Recommended For
Ideal for CFO executive reports, investor relations presentations, business unit quarterly reviews, management consulting proposals, and any corporate presentation requiring data-driven decision support. Suitable for finance teams, business analysts, and strategic planners.
-
Slide Structure
Two-slide set with identical layout structure: left text area (title, subtitle, description) and right 10-step bar chart area. First slide uses light gray background; second slide features dark gray background for design variation. Both slides include a red accent bar at the bottom for brand consistency and visual hierarchy.
Related Products
-

Visualizing Annual Sales Performance Trends - Graph Slide
#Business Strategy #Financial Plans and Performance #Graph
-

500% Goal Achieved Graph – Challenge and Achievement
#Business Strategy #Financial Plans and Performance #Graph
-

Sales Profit Status Chart – Performance Focused Donut Design
#Business Strategy #Financial Plans and Performance #Graph
-

Revenue Breakthrough: Achieving All-Time Highs with Bar Graphs
#Business Strategy #Financial Plans and Performance #Graph
