Growth Over Time Slide – Cluster and Connection Design
RB0800037_4
- Last Update 03/25/2025
- File Size 4.3MB
- # of Slides 2
- File Format PPTX
- Slide Ratio 4:3
- Color
Keywords
- #Content-Based Slides
- #Design-Based Slides
- #Company Introduction
- #Diagram
- #History
- #Cluster
- #Chain Diagram
- #4:3
- #radial diagram PowerPoint
- #cluster diagram slide
- #connection structure diagram
- #corporate growth visualization
- #node connection slide
- #timeline diagram PowerPoint
- #how to create timeline in PowerPoint
About the Product
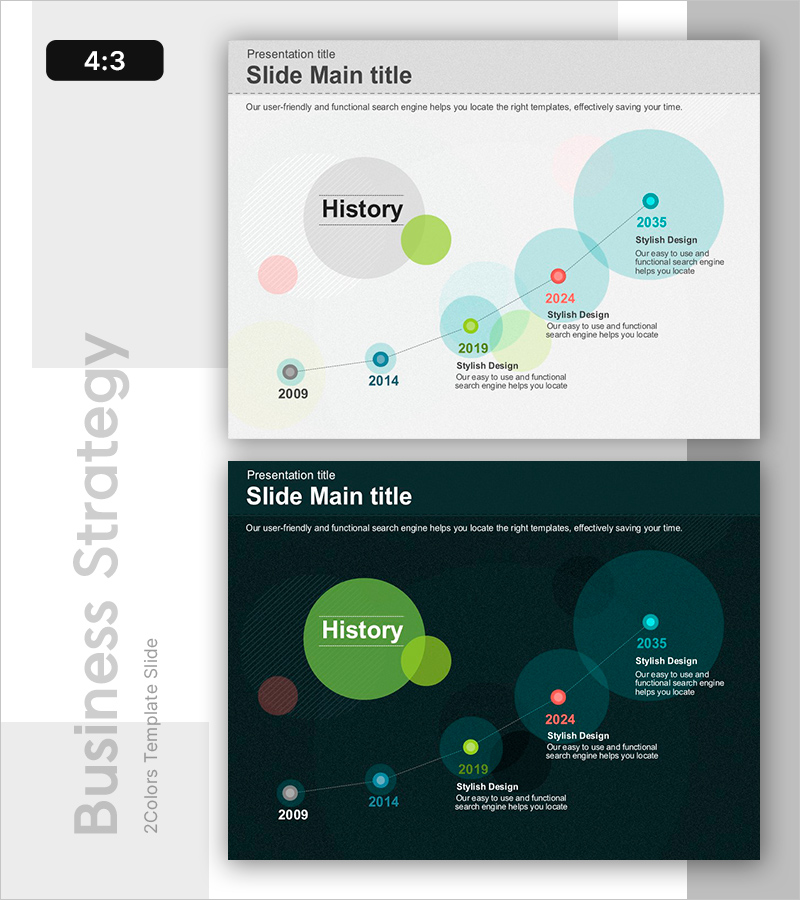
A radial cluster diagram PowerPoint slide that visualizes corporate growth and development milestones over time. The central 'History' node radiates outward to five year-based milestones (2009, 2014, 2019, 2024, 2035), with each node sized and colored to represent importance and progression. Two design variations are included: a light gray background version with bright tones and a dark teal background version with muted tones. Connection lines and circular nodes intuitively convey temporal flow and relationships. Available in 4:3 ratio PPTX format for immediate editing, suitable for corporate history presentations, annual performance reviews, organizational expansion narratives, and project evolution timelines.
Usage Points
-
Main Usage
Represents corporate historical development stages, year-by-year milestones, and organizational growth progression through a radial structure expanding from a central core. Node size and color variations simultaneously convey temporal sequence and relative importance, enhancing audience comprehension and engagement.
-
How to Use
Apply to company profile 'Corporate History' sections, business plan 'Growth Roadmap' slides, and investor pitch 'Past Performance & Future Vision' presentations. Edit node text and colors to customize representation of your company's key events, achievements, and strategic objectives.
-
Recommended For
Recommended for corporate executives, marketing teams, investor relations professionals, and business development teams presenting at shareholder meetings, partnership proposals, and external stakeholder presentations. Effective for both startup growth stage visualization and large enterprise long-term development narratives.
-
Slide Structure
Central 'History' node (gray circle) with five year-based nodes (2009, 2014, 2019, 2024, 2035) arranged radially outward, each connected to the center by lines. Node sizes increase progressively, with colors differentiated across pink, lime, light blue, and teal palette. Descriptive text areas positioned adjacent to each node for customization.
Related Products
-

History Road Diagram – A Cluster Diagram Ideal for Company Introduction
#Company Introduction #Diagram #History
-

Business History Diagram – Visualizing Organizational Growth
#Company Introduction #Diagram #History
-

Company History Mini Diagram – Clear and Concise Timeline
#Company Introduction #Diagram #History
-

Introduction to the History of the Architectural Company – A Visual Timeline
#Company Introduction #Diagram #Company Overview
