Ribbon Title and Table Slide – Visualizing Financial Performance
RB0800030_14
- Last Update 03/24/2025
- File Size 3.9MB
- # of Slides 2
- File Format PPTX
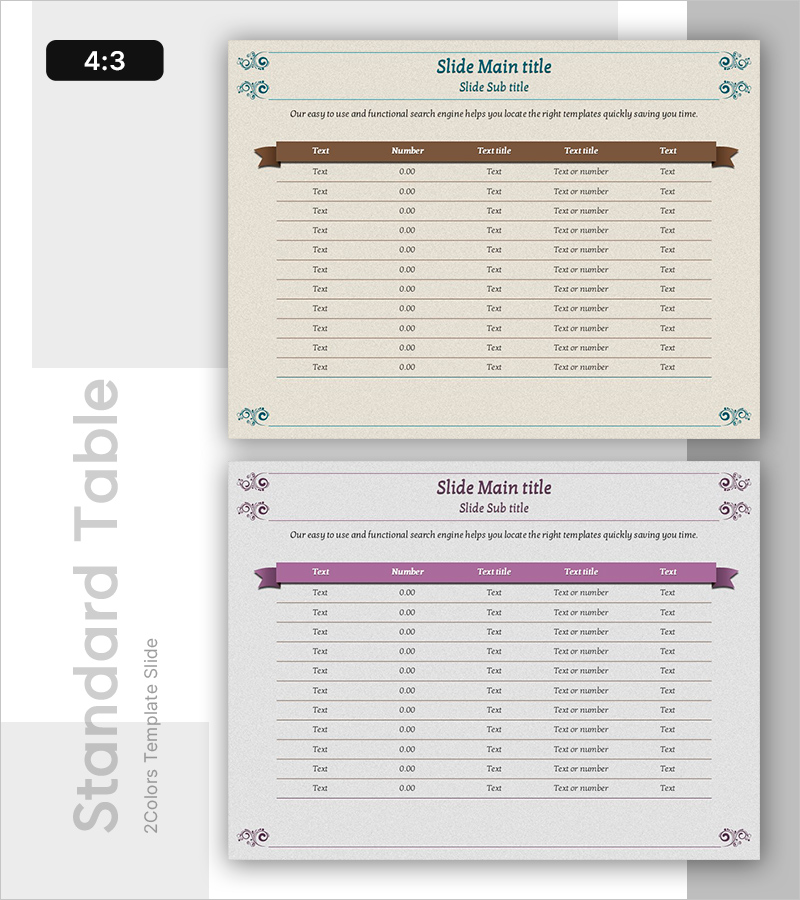
- Slide Ratio 4:3
- Color
Keywords
About the Product
A structured table PowerPoint slide designed for presenting financial data and performance metrics with clarity and impact. The slide features a brown ribbon header with a beige background, organized in a 5-column by 10-row layout that accommodates numbers, text, and ratio data simultaneously. This versatile table slide is ready to use in financial reports, business plans, and performance analysis presentations. The 4:3 aspect ratio set includes two color variations—brown and purple ribbon versions—allowing you to match your presentation theme while maintaining consistent data visualization.
Usage Points
-
Main Usage
Presents financial metrics, sales figures, and key performance indicators in a clear, organized table format. The ribbon header visually separates and emphasizes the data section, making it easy for audiences to scan and understand numerical information at a glance.
-
How to Use
Use in financial reports, quarterly earnings presentations, business plan decks, and investor pitch meetings to display revenue, profit margins, growth rates, and other financial metrics. Simply input your data into each cell and adjust colors to highlight key figures or trends.
-
Recommended For
CFOs, finance managers, executives, and investor relations professionals presenting financial performance. Also valuable for marketing teams displaying sales figures, customer satisfaction scores, and campaign performance metrics in a structured format.
-
Slide Structure
Organized with 5 columns (text, number, text title, text title, text) and 10 data rows, allowing flexible input of mixed content types. The ribbon banner header anchors the top, with each cell sized to accommodate both text and numerical values without crowding.
Related Products
-

Key Financial Indicators by Sector – Concise and Stylish Design
#Financial Plans and Performance #Diagram #Sales and Revenue
-

Capital Sales Analysis Graph – Visualizing Financial Performance
#Financial Plans and Performance #Diagram #Graph
-

Logistics Factor Comparison Table – Intuitive Data Analysis
#Financial Plans and Performance #Diagram #Sales and Revenue
-

Orange Red Point Table – Visualization of Financial Performance
#Financial Plans and Performance #Diagram #Sales and Revenue
