Key Financial Indicators by Year – Insights for Financial Analysis
RM0600004_28
- Last Update 02/24/2025
- File Size 0.2MB
- # of Slides 2
- File Format PPTX
- Slide Ratio 16:9
- Color
Keywords
- #Content-Based Slides
- #Design-Based Slides
- #Financial Plans and Performance
- #Diagram
- #Sales and Revenue
- #Key Financial Indicators
- #Table
- #16:9
- #financial indicators PowerPoint slide
- #year-over-year financial comparison
- #financial analysis table slide
- #quarterly performance metrics PPT
- #how to present financial data in PowerPoint
About the Product
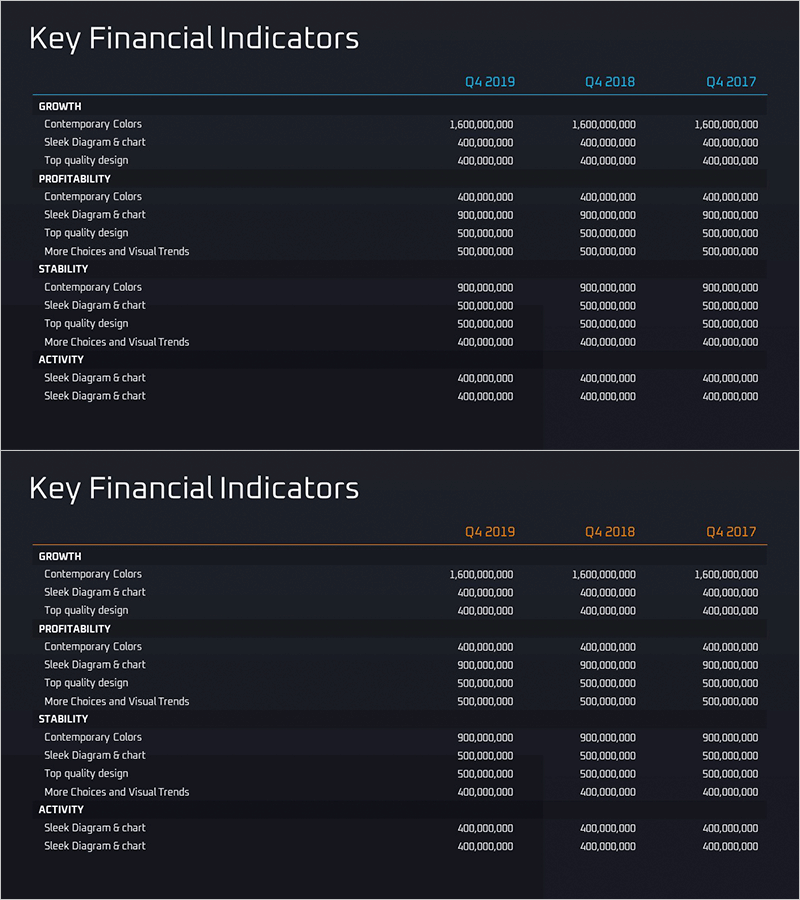
A PowerPoint slide template for comparing quarterly and year-over-year financial indicators at a glance. Organized into four key categories—Growth, Profitability, Stability, and Activity—with detailed metrics (revenue, profit, assets, cash flow, etc.) displayed across Q4 2019, Q4 2018, and Q4 2017 for easy year-on-year analysis. The dark background with orange accent headers enhances readability and professional presentation. Ideal for investor reports, financial analysis presentations, executive briefings, and business planning sessions to communicate key financial performance with credibility. The 2-slide set provides identical layouts for seamless data input and consistency.
Usage Points
-
Main Usage
Systematically compare quarterly and year-over-year financial performance while visualizing four critical metrics—growth, profitability, stability, and activity—on a single slide to communicate financial credibility to investors, executives, and stakeholders.
-
How to Use
Use in investor relations materials, financial analysis presentations, executive reports, and business planning sessions by inputting quarterly and annual financial figures into the table format. The high-contrast dark layout ensures excellent readability in projector-based presentation environments.
-
Recommended For
CFOs, financial managers, investor relations specialists, executives, and business planning teams who need to report quarterly and annual financial performance or prepare financial analysis materials.
-
Slide Structure
Two-slide set with identical layouts. Each slide is divided into four sections (Growth, Profitability, Stability, Activity), with 3–4 detailed metrics per section compared across three years (Q4 2019, Q4 2018, Q4 2017) in table format.
Related Products
-

Minimal Block Table for Revenue and Profit Analysis – Emphasizing Financial Performance
#Financial Plans and Performance #Diagram #Sales and Revenue
-

Orange Red Point Table – Visualization of Financial Performance
#Financial Plans and Performance #Diagram #Sales and Revenue
-

Table Chart and Descriptive Text – Visualizing Sales Metrics
#Financial Plans and Performance #Diagram #Sales and Revenue
-

Orange Hexagon Presentation Template Table – Visualization of Revenue and Profit
#Financial Plans and Performance #Diagram #Sales and Revenue
