Market Overview with Pie Charts and Tables
RB0800030_10
- Last Update 03/24/2025
- File Size 3.9MB
- # of Slides 2
- File Format PPTX
- Slide Ratio 4:3
- Color
Keywords
About the Product
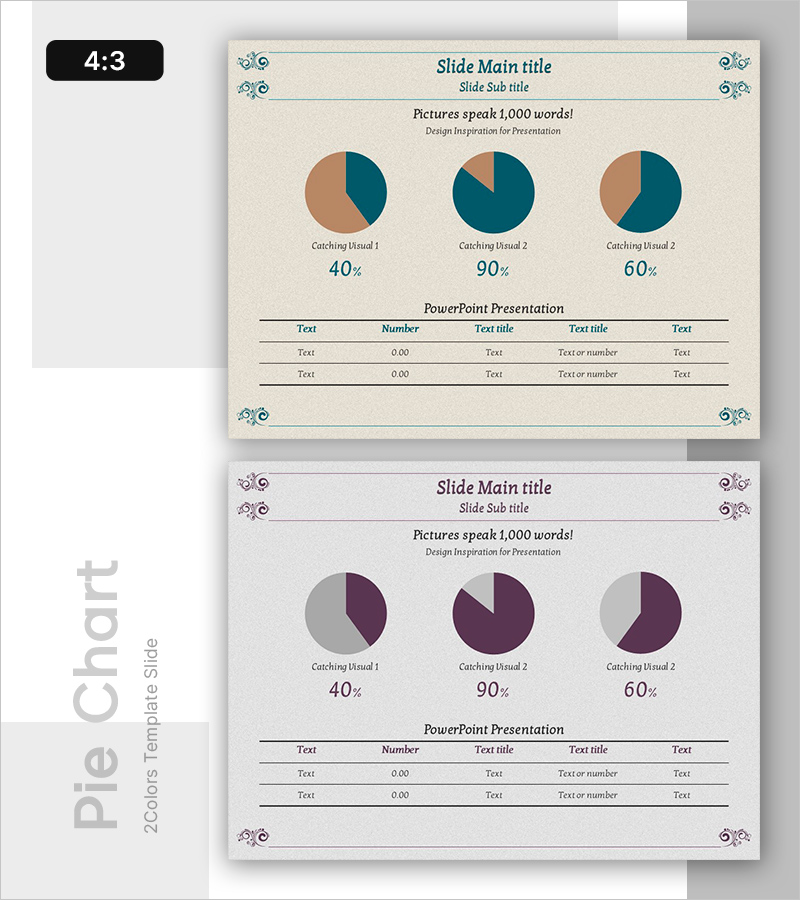
A professional PowerPoint slide that presents market overview data using pie charts and data tables for clear visual communication. Three circular pie charts display proportional data (40%, 90%, 60%) in teal and tan colors against a beige background, with labels and percentages positioned directly below each chart. A five-column data table at the bottom provides structured numerical information. This 4:3 ratio, 2-slide template is ready to use for market analysis presentations, executive reports, and business proposals.
Usage Points
-
Main Usage
Effectively communicate market size, market share, and compositional ratios by combining pie charts with supporting data tables, enabling stakeholders to quickly understand the relationship between parts and the whole.
-
How to Use
Replace the pie chart percentages and labels with your actual market data, and customize the table rows and columns to match your dataset. Ideal for executive presentations, market research reports, competitive analysis, and business proposal decks.
-
Recommended For
Marketing professionals, business analysts, market researchers, and strategy managers presenting market conditions, customer segmentation, revenue composition, and competitive positioning to executives and stakeholders.
-
Slide Structure
Slide 1: Title section with three pie charts (40%, 90%, 60% proportions) in teal and tan, each with percentage labels and legend text below. Slide 2: Five-column by three-row data table for numerical information. Beige background with teal and tan accent colors throughout.
Related Products
-

Compact Data Visualization Slide - Analysis and Insights
#Market and Competitor Analysis #Diagram #Graph
-

Market Overview PowerPoint Slide – Two Panel Market Analysis
#Market and Competitor Analysis #Graph #Market Status
-

Key Statistics Overview Slide – Market Analysis and Competitive Context
#Market and Competitor Analysis #Diagram #Graph
-

Chart Analysis of Aerobic Exercise – Market Share Visualization
#Market and Competitor Analysis #Diagram #Graph
