Gradient Expected Outlook Graph – Visualization of Data Analysis
RB0800029-1_6
- Last Update 03/24/2025
- File Size 0.4MB
- # of Slides 2
- File Format PPTX
- Slide Ratio 4:3
- Color
Keywords
About the Product
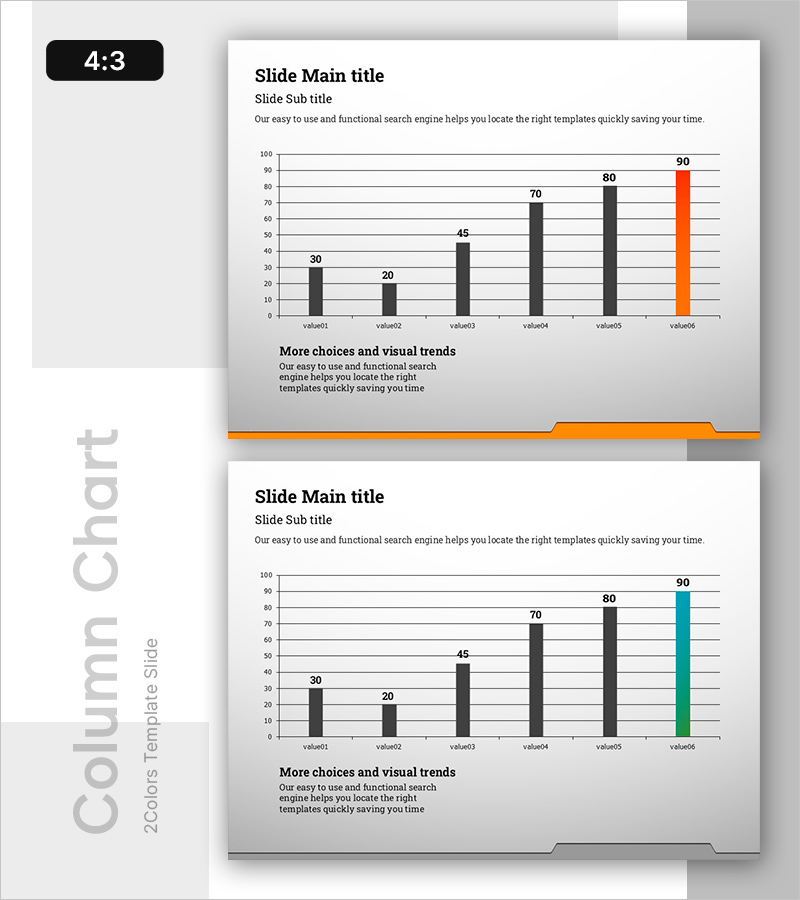
A horizontal bar chart PowerPoint slide comparing six data values with visual emphasis on the highest or target value. The first five bars are displayed in dark gray, while the final bar is highlighted in orange to draw attention to peak performance or goal achievement. This 4:3 aspect ratio template includes two slides: the first features a title section with the chart, and the second provides an identical layout with a cyan accent color option. Each bar displays its corresponding value label (30, 20, 45, 70, 80, 90) for clear data communication. Fully editable for colors, labels, and numerical values to fit your presentation needs.
Usage Points
-
Main Usage
Visualizes and compares six quantitative metrics such as sales figures, market share, performance indicators, or competitive benchmarks. The horizontal bar format enables intuitive comparison of relative magnitudes, while color emphasis highlights the most important data point.
-
How to Use
Insert into business plans, marketing proposals, or performance reports in sections covering market analysis, sales results, or competitive positioning. Edit bar values and labels with your actual data, and adjust the number of bars as needed for your dataset.
-
Recommended For
Sales, marketing, and planning teams presenting quarterly or annual performance reviews, executive reports, and investor pitch decks where quantitative data clarity is essential.
-
Slide Structure
Two-slide template in 4:3 ratio PPTX format. Slide 1: Title and subtitle area with 6-bar horizontal chart (5 dark bars + 1 orange accent bar) and legend text. Slide 2: Identical layout with cyan accent option. All elements including colors, labels, and values are fully editable.
Related Products
-

Status of Research and Development by Topic – Innovation and Trust
#Product/Service Introduction #Market and Competitor Analysis #Diagram
-

Bar Chart Visualizing Freight Transport Trends – Essential Market Analysis Tool
#Market and Competitor Analysis #Graph #Text Box
-

Blue Radar Chart Analysis – Insights for Products and Services
#Product/Service Introduction #Graph #Features
-

Donut Charts of Animals and Plants – Effective Market Analysis Tool
#Business Strategy #Market and Competitor Analysis #Diagram
