Stylish PowerPoint for Visualizing Business Processes
RB0800028-1_33
- Last Update 03/23/2025
- File Size 0.2MB
- # of Slides 2
- File Format PPTX
- Slide Ratio 4:3
- Color
Keywords
- #Content-Based Slides
- #Design-Based Slides
- #Business Strategy
- #Diagram
- #Implementation Framework
- #Flow
- #Linear Flow
- #Project Progress
- #4:3
- #arrow flow diagram PowerPoint
- #4-step process slide
- #business process visualization
- #sequential workflow PPT
- #project phase diagram
- #process flow slide template
About the Product
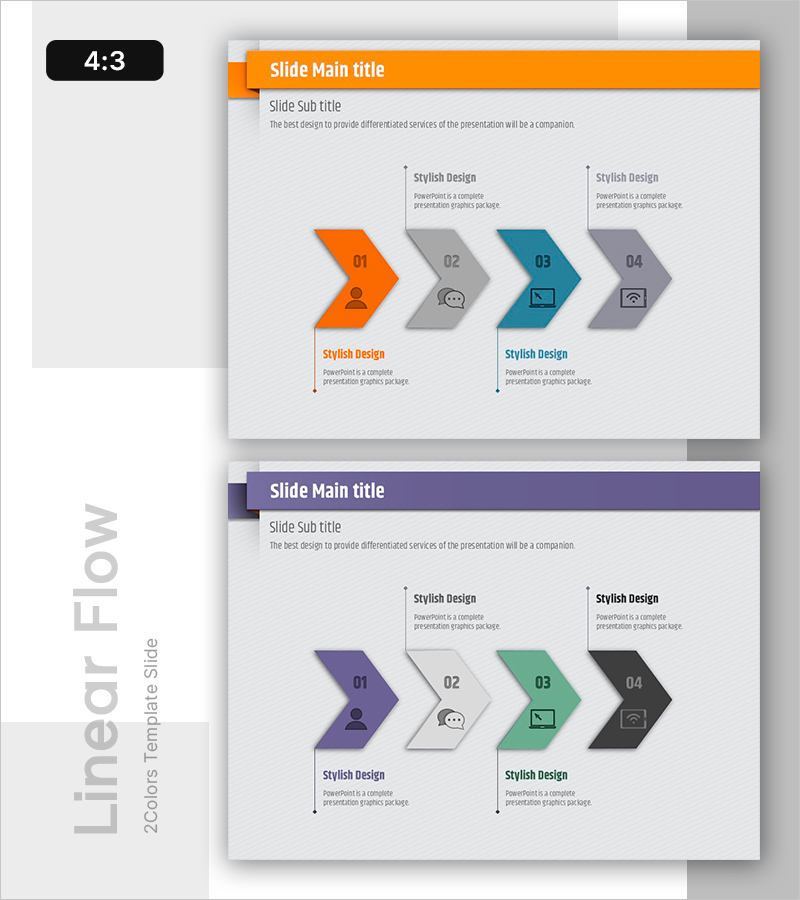
A sequential arrow flow diagram PowerPoint slide designed to visualize business processes and project progression stages. Four arrow-shaped nodes connect left-to-right, making it ideal for illustrating project phases, workflow steps, service processes, and implementation timelines. The design uses a vibrant color palette—orange, gray, teal, and purple—to distinguish each stage, with integrated icons and text areas for enhanced information clarity. Delivered as 2 slides in 4:3 aspect ratio, fully editable PPTX format for immediate customization.
Usage Points
-
Main Usage
Ideal for illustrating project timelines, operational workflows, service delivery processes, and marketing campaign phases. Each stage can display responsible teams, deadlines, and deliverables, making it perfect for cross-functional collaboration and progress tracking presentations.
-
How to Use
Insert into proposal decks, business plans, or status reports in the 'Implementation Strategy' or 'Execution Plan' sections. Use in executive briefings, client presentations, and team meetings to explain project roadmaps and sequential decision-making processes with visual clarity.
-
Recommended For
Project managers, management consultants, marketing professionals, planning teams, and sales representatives presenting progress updates. Particularly effective for organizations requiring stage-gate decision processes, change management initiatives, and product launch announcements.
-
Slide Structure
2-slide set with 4:3 aspect ratio. Slide 1 features orange header with 4 arrow nodes (01–04) arranged left-to-right, each with icon, text field, and description area below. Slide 2 uses purple header with identical layout for comparative process visualization. All elements are fully editable.
Related Products
-

Linear Diagram for Effective Visualization of Business Progress
#Business Strategy #Diagram #Implementation Framework
-

Diagram Slide Connecting Business Strategy
#Business Strategy #Diagram #Implementation Framework
-

Visualizing Systematic Learning Methods
#Business Strategy #Diagram #Implementation Framework
-

Military Supplies and Flow Diagrams – Business Strategy
#Business Strategy #Diagram #Implementation Framework
