Graph Slide Visualizing Sales Trends by Product
RB0800024_10
- Last Update 03/22/2025
- File Size 1.5MB
- # of Slides 2
- File Format PPTX
- Slide Ratio 4:3
- Color
Keywords
About the Product
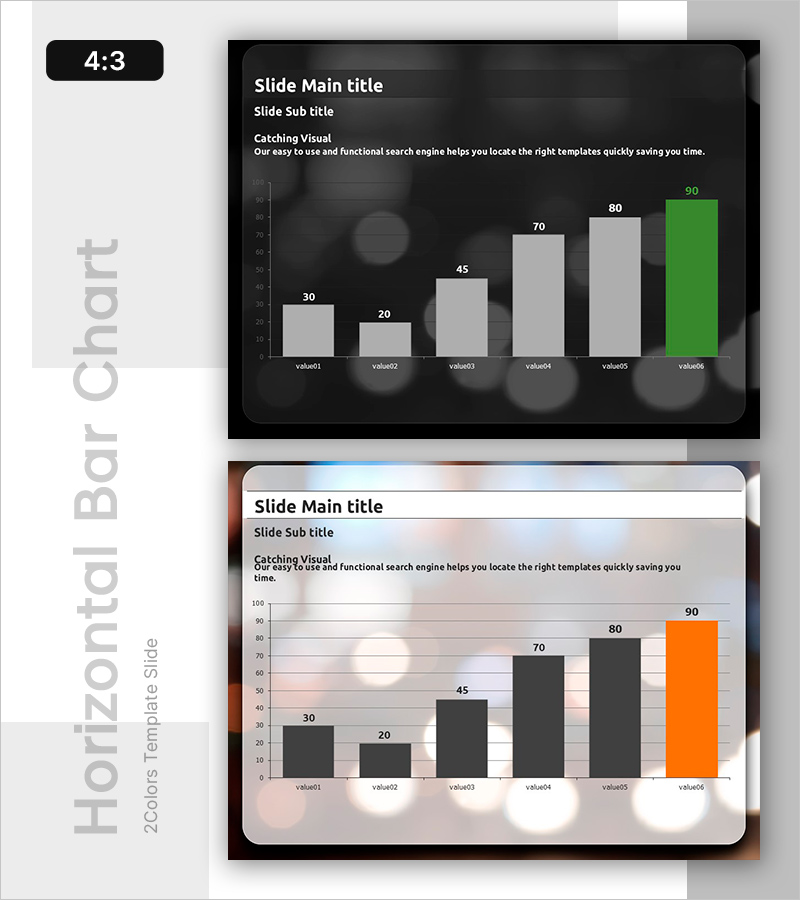
A horizontal bar chart PowerPoint slide that visualizes product sales trends and comparisons across six categories. Designed with a dark background and white, gray, and green accent bars, this slide effectively highlights numerical differences and emphasizes key data with a contrasting color on the final bar. The 2-slide set includes title, subtitle, and description text areas for immediate customization. Perfect for business presentations including sales performance reports, quarterly results, product category analysis, and comparative data visualization in professional settings.
Usage Points
-
Main Usage
Designed to compare sales performance across products, departments, or regions while visualizing achievement trends. Bar length intuitively represents numerical differences, and the accent color on the final bar highlights top performance or target achievement.
-
How to Use
Enter your presentation topic in the title and subtitle areas, then replace bar values and labels with actual data. The dark background ensures excellent readability in projector environments, while the accent bar effectively emphasizes highest performance or key metrics.
-
Recommended For
Ideal for sales and marketing team quarterly performance presentations, executive reports, product category sales analysis, regional revenue comparisons, and financial performance reviews. Suitable for planning and finance departments' analytical presentations.
-
Slide Structure
2-slide set with title, subtitle, and description text areas on each slide. Six horizontal bars display values of 30, 20, 45, 70, 80, and 90, with the final bar (90) highlighted in green. Provided in 4:3 aspect ratio PPTX format with fully editable elements.
Related Products
-

Interior Demand Area Graph – Market Analysis Tool
#Market and Competitor Analysis #Graph #Other
-

Horizontal Bar Graph for Product Performance Analysis
#Market and Competitor Analysis #Financial Plans and Performance #Graph
-

Visualizing Market Analysis with Yearly Round Bar Graph
#Market and Competitor Analysis #Graph #Market Analysis
-

Red-Blue Stereoscopic Pie Charts – Performance Visualization
#Company Introduction #Market and Competitor Analysis #Diagram
