Visual Slide for Korea's Development Status
RB0800023_12
- Last Update 03/22/2025
- File Size 7.6MB
- # of Slides 2
- File Format PPTX
- Slide Ratio 4:3
- Color
Keywords
- #Content-Based Slides
- #Design-Based Slides
- #Company Introduction
- #Product/Service Introduction
- #Other
- #Domestic Network
- #Development Status
- #4:3
- #Korea development status PowerPoint slide
- #regional hub map presentation
- #business location visualization slide
- #Korean peninsula map template
- #development center location PPT
About the Product
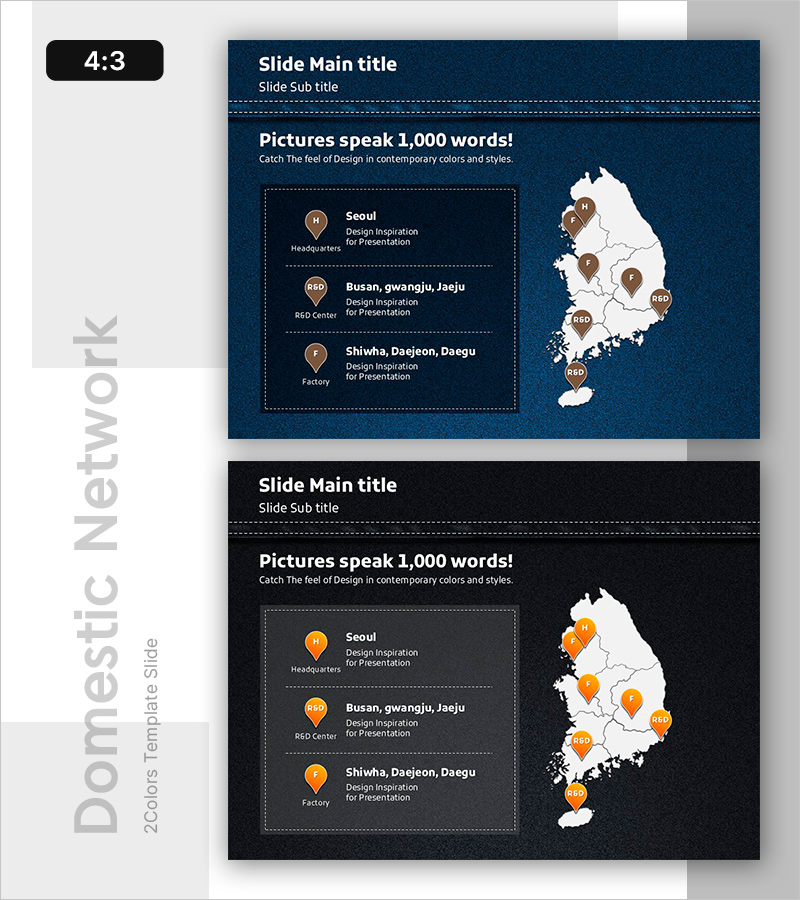
A 2-slide PowerPoint presentation visualizing Korea's major development hubs on a geographic map. The dark blue background features a Korean peninsula map with key cities including Seoul, Busan, and Daegu marked with icons and text labels. Each hub location is clearly differentiated by role (headquarters, R&D center, factory, etc.) in an easy-to-edit structure. Perfect for presenting company operations across regions, business hub distribution, or development center locations. All elements are fully editable in PowerPoint, allowing you to adjust text and icon positions to match your organization's actual structure.
Usage Points
-
Main Usage
Designed to display the geographic distribution of domestic business hubs at a glance. By using icons and text to differentiate each hub's role (headquarters, R&D center, factory), this slide effectively communicates your company's domestic business structure and operational footprint.
-
How to Use
Use in company overview presentations during the business hub introduction section, or in business strategy presentations when explaining regional expansion status. Customize the text and icons for each hub to match your actual organizational structure and locations.
-
Recommended For
Ideal for company profile presentations, business plans, and investor relations (IR) materials when introducing domestic business hubs. Particularly effective when explaining regional business expansion, new center openings, or hub consolidation initiatives.
-
Slide Structure
Left side displays three hub locations with their names and roles in text boxes, while the right side shows a Korean peninsula map with each hub marked by location icons. Dark blue background with white text and brown icons creates strong visual contrast for improved readability.
Related Products
-

Key Locations with Speech Bubble Indicators
#Company Introduction #Product/Service Introduction #Other
-

Target Area Line Graphic – Powerful Visual Presentation
#Company Introduction #Product/Service Introduction #Other
-

Insights by Location – Data Visualization and Analysis
#Company Introduction #Product/Service Introduction #Other
-

Visualizing South Korea's Market Share – Data-Driven Insights
#Company Introduction #Market and Competitor Analysis #Graph
