Target Area Line Graphic – Powerful Visual Presentation
RB0800019_17
- Last Update 03/21/2025
- File Size 2.7MB
- # of Slides 2
- File Format PPTX
- Slide Ratio 4:3
- Color
Keywords
About the Product
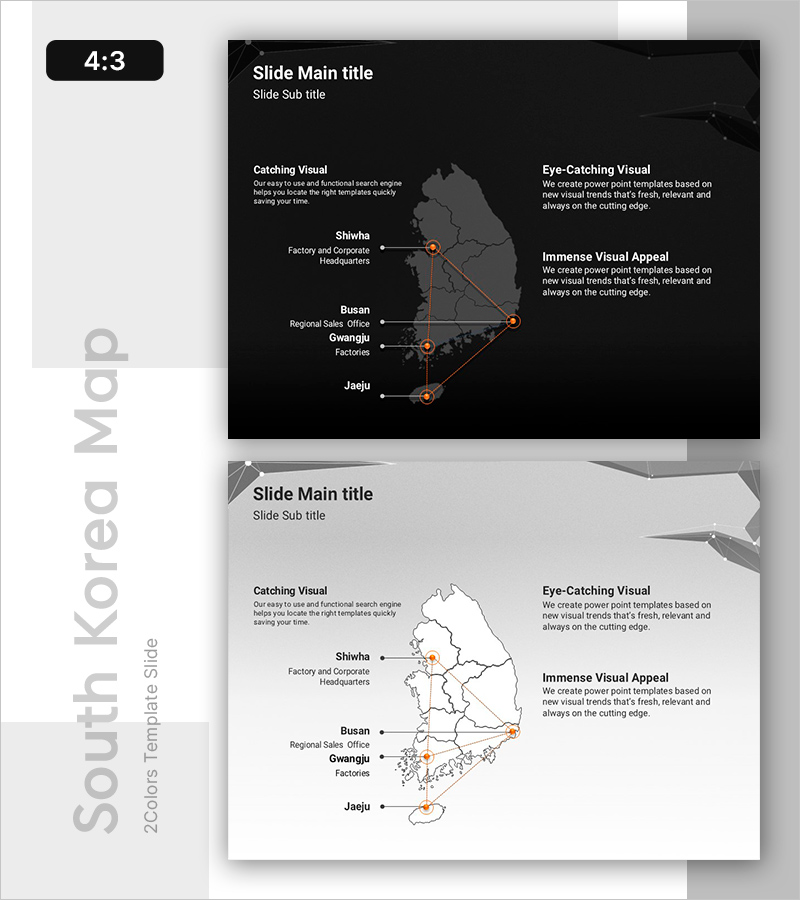
A PowerPoint slide that visualizes nationwide regional hub locations and interconnection relationships using line graphics. Two versions are provided—dark background with grayscale map and light background with white map—allowing you to choose based on your presentation environment. Major cities (Seoul, Busan, Gwangju, Jaeju) are marked with orange circular indicators, and linear connection lines emphasize the network between hubs. Text areas are divided into left (3 items) and right (3 items) sections, enabling clear placement of location-specific descriptions. This presentation slide effectively communicates your company's nationwide hub status, distribution network structure, and regional business expansion.
Usage Points
-
Main Usage
Visualizes nationwide regional hub locations, distribution network structure, and business networks using map-based line graphics. Markers and connection lines intuitively express regional relationships and distances, enhancing audience comprehension.
-
How to Use
Enter hub names, functions (headquarters, branch, factory, sales office), and responsible departments in the left and right text areas. Adjust marker colors and line thickness to represent hub importance or transaction volume.
-
Recommended For
Ideal for company profile presentations covering global networks and domestic hubs, business expansion status reports, distribution and logistics company hub descriptions, regional sales organization structure explanations, and investor presentations on business expansion plans.
-
Slide Structure
Two-slide set: dark background version (grayscale map, orange markers, white text) and light background version (white map, orange markers, black text). Each slide features a central map area with three text boxes on each side (total 6 input fields for location details).
Related Products
-

Insights by Location – Data Visualization and Analysis
#Company Introduction #Product/Service Introduction #Other
-

Key Locations with Speech Bubble Indicators
#Company Introduction #Product/Service Introduction #Other
-

Visual Slide for Korea's Development Status
#Company Introduction #Product/Service Introduction #Other
-

Visualization of Korea's Target Area – Practical Network Diagram
#Company Introduction #Other #Domestic Network
