Timeline Slide Visualizing Current Security Posture
RM0800011_3
- Last Update 03/01/2025
- File Size 2.6MB
- # of Slides 2
- File Format PPTX
- Slide Ratio 16:9
- Color
Keywords
- #Content-Based Slides
- #Design-Based Slides
- #Company Introduction
- #Business Strategy
- #Diagram
- #History
- #Cluster
- #Chain Diagram
- #Project Progress
- #16:9
- #timeline diagram PowerPoint
- #annual timeline presentation slide
- #business progress timeline
- #security posture slide template
- #how to create timeline in PowerPoint
- #timeline slide design download
About the Product
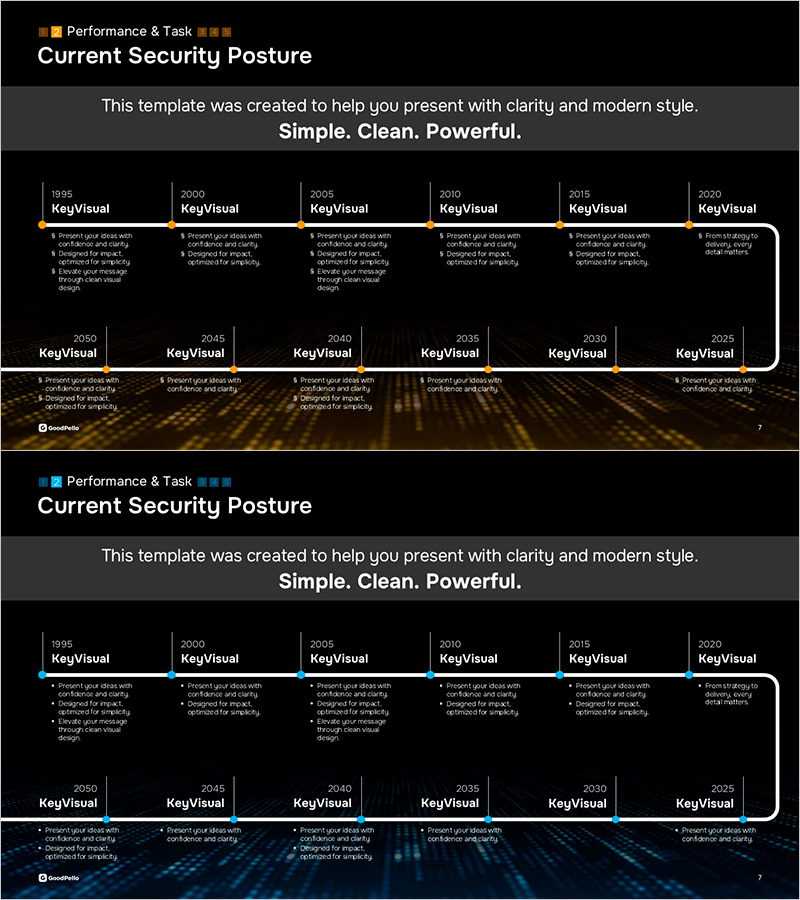
A timeline diagram PowerPoint slide that visualizes the year-by-year evolution of security frameworks. The slide spans from 1995 to 2050 with six time periods arranged horizontally, each with dedicated text input areas for key information. Set against a black background with orange accent lines and a gold gradient footer, this design effectively communicates corporate security strategies, business progress timelines, and technology roadmaps. The 2-slide set offers layout variations with fully editable text and color options for customization.
Usage Points
-
Main Usage
Clearly visualizes corporate security policy evolution, business execution timelines, and technology development stages across multiple years. The horizontal timeline structure enables audiences to grasp historical progress and future projections at a glance, effectively communicating key achievements and objectives for each period.
-
How to Use
Ideal for executive briefings, security policy announcements, business plan presentations, and technology roadmap discussions. Customize by entering text in each year box and adjusting colors to match organizational branding. Leverage the title section and footer description area to reinforce context and key messages.
-
Recommended For
IT security teams, executives, business strategists, and technology leaders presenting security initiatives, business progress, or technology development plans. Particularly suited for financial institutions, IT companies, and manufacturing organizations where long-term strategic planning is critical.
-
Slide Structure
2-slide set with identical timeline structure. Each slide displays 6 time periods (1995–2050) arranged horizontally. Layout includes year labels at top, multi-line text input areas in the middle section, and a gold gradient footer with additional description space. Black background with orange accent lines creates visual hierarchy and emphasis.
Related Products
-

Journey of Change by Year – Business Strategy Visualization
#Company Introduction #Business Strategy #Diagram
-

Adventure Company History 4 Color Connection Diagram
#Company Introduction #Business Strategy #Diagram
-

Timeline of Health Routine Evolution – Visualizing Business Strategies
#Company Introduction #Business Strategy #Diagram
-

Environmental Protection Company History Diagram Slide – Blue and Brown Harmony
#Company Introduction #Diagram #History
