Segmented Solutions: Streamlining Processes by Division
RB0800022_15
- Last Update 03/22/2025
- File Size 1MB
- # of Slides 2
- File Format PPTX
- Slide Ratio 4:3
- Color
Keywords
- #Content-Based Slides
- #Design-Based Slides
- #Product/Service Introduction
- #Business Strategy
- #Diagram
- #Composition
- #Cluster
- #Inclusive Cluster Diagram
- #Chain Diagram
- #4:3
- #vertical diagram PowerPoint
- #capsule process slide
- #3-step flow chart
- #process flow diagram PowerPoint
- #business process visualization slide
About the Product
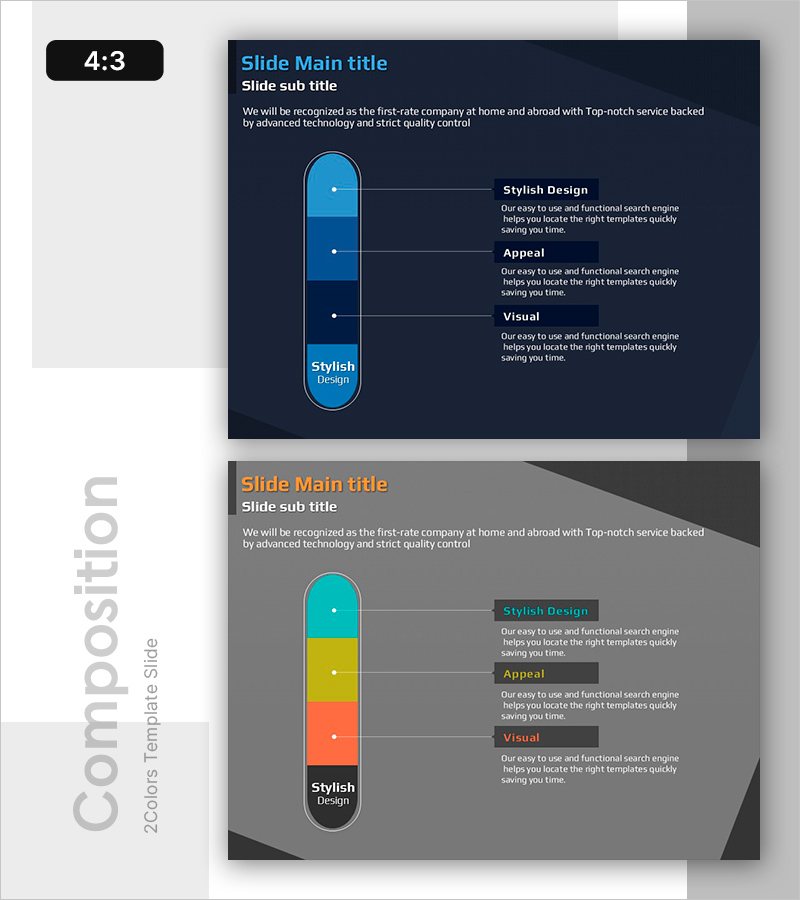
A vertical capsule-shaped diagram PowerPoint slide that visualizes a 3-step process flow. The design features a dark navy background with light blue gradient capsules and white typography, clearly emphasizing each stage. The left capsule displays the step name, while the right side contains detailed description text boxes connected by connector lines. This PowerPoint template is ready to use for business presentations including process optimization, divisional strategies, phased implementation plans, and strategic roadmaps.
Usage Points
-
Main Usage
Ideal for visualizing business processes, divisional optimization strategies, and phased implementation plans. The capsule-shaped design emphasizes each stage's key content, directing audience attention to critical information points.
-
How to Use
Enter step names (Step 1, Step 2, Step 3) in the left capsules and detailed descriptions in the right text boxes. Colors and text are fully editable to match your corporate brand. Additional steps can be added by duplicating and arranging the shape elements vertically.
-
Recommended For
Executive reports, strategic presentations, business plan explanations, marketing proposals, organizational restructuring presentations, and project management documents. Suitable for professionals in consulting, finance, IT, manufacturing, and other industries requiring process visualization.
-
Slide Structure
2-slide set in 4:3 aspect ratio. First slide features dark navy background with 3 light blue gradient capsules arranged vertically, each connected to a text box on the right via connector lines. Second slide presents the same structure with gray background and multi-color capsules (cyan, yellow, orange, red) for alternative styling.
Related Products
-

Stylish Design for Distinctive Presentation Support
#Business Strategy #Operational Plan #Diagram
-

Process Flow Diagram with Steps – Business Strategy Direction
#Business Strategy #Operational Plan #Diagram
-

E-Learning Learning Effect Diagram – Visualizing Business Strategies
#Business Vision and Strategy #Business Strategy #Diagram
-

Decoding the 3 Embedded Keywords - Concept Visualization through Diagram
#Product/Service Introduction #Technical Approach #Diagram
