Stylish Diagram Slide – Top Quality Design
RB0800015_12
- Last Update 03/20/2025
- File Size 0.3MB
- # of Slides 2
- File Format PPTX
- Slide Ratio 4:3
Keywords
About the Product
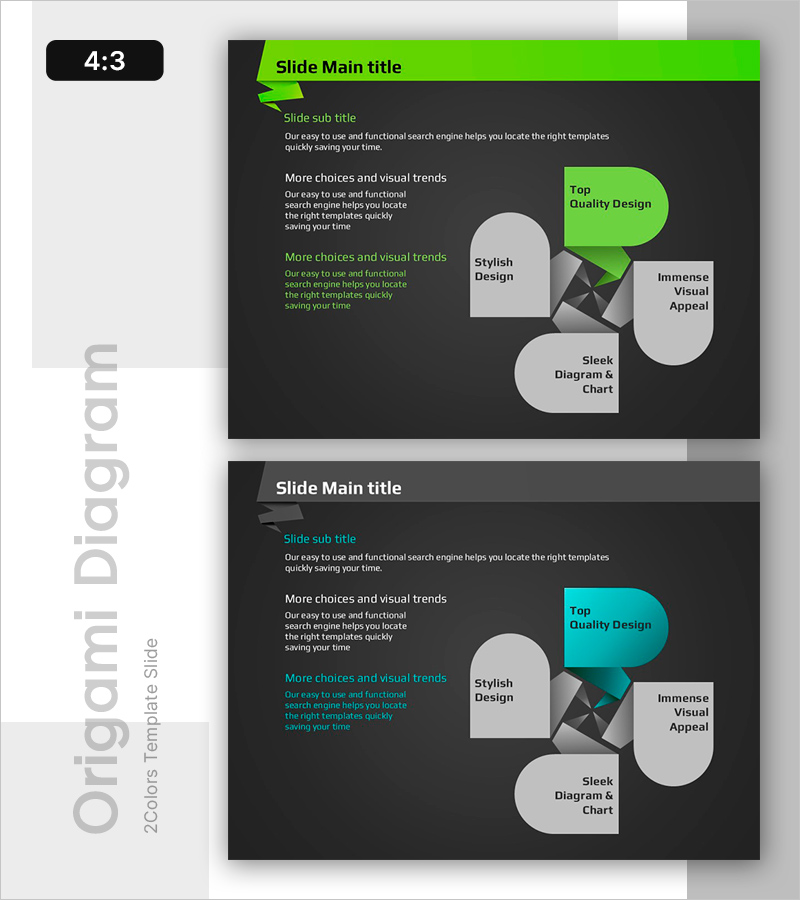
A 2-slide diagram PowerPoint presentation featuring a dark background with lime green accent colors. The layout combines a left-side text area with a right-side 5-element circular comparison structure, allowing independent data input for each element. This presentation slide is optimized for comparing company strengths, product features, or service components, and comes in fully editable PPTX format for immediate use.
Usage Points
-
Main Usage
This slide specializes in visualizing 5 parallel items or hierarchical relationships simultaneously. It effectively presents company core strengths, product key features, service components, or competitive advantages while enhancing audience comprehension through clear visual organization.
-
How to Use
Enter your title and description in the left text area, then populate each of the 5 circular elements with item names and supporting details. Use the lime green accent box to highlight the most important item, and customize colors to match your corporate brand identity.
-
Recommended For
Executive reports, investor presentations, product launches, marketing proposals, organizational capability overviews, and various business presentations requiring multi-item comparison. Particularly effective when explaining multiple items with equal emphasis.
-
Slide Structure
The 2-slide set features a left text input area (1 title, 1 subtitle, 3 body sections) paired with a right-side 5-element circular comparison diagram. Slide 1 uses lime green accents while Slide 2 features cyan accents, providing color variation options.
Related Products
-

Project Overview PowerPoint Slide – 4-Spec Dark Real Estate
#Product/Service Introduction #Business Strategy #Diagram
-

Plogging Route Presentation Slide – 9-Point S-Curve Timeline
#Company Introduction #Business Strategy #Corporate Social Responsibility
-

F&B Menu PowerPoint Slide – Circular 4-Step Process Layout
#Operational Plan #Diagram #Business Processes
-

Company Capabilities PowerPoint Slide – 3-Circle Icon Layout
#Company Introduction #Product/Service Introduction #Business Vision and Strategy
