Mint Yellow Table Slide – An Efficient Tool for Business Management
RB0800014_7
- Last Update 03/20/2025
- File Size 0.1MB
- # of Slides 2
- File Format PPTX
- Slide Ratio 4:3
- Color
Keywords
- #Content-Based Slides
- #Design-Based Slides
- #Product/Service Introduction
- #Business Management
- #Diagram
- #Composition
- #Reporting and Review Plan
- #Table
- #Standard Table
- #4:3
- #table slide PowerPoint
- #data table template
- #business management presentation
- #4-column 7-row table
- #mint yellow slide design
- #report table template
About the Product
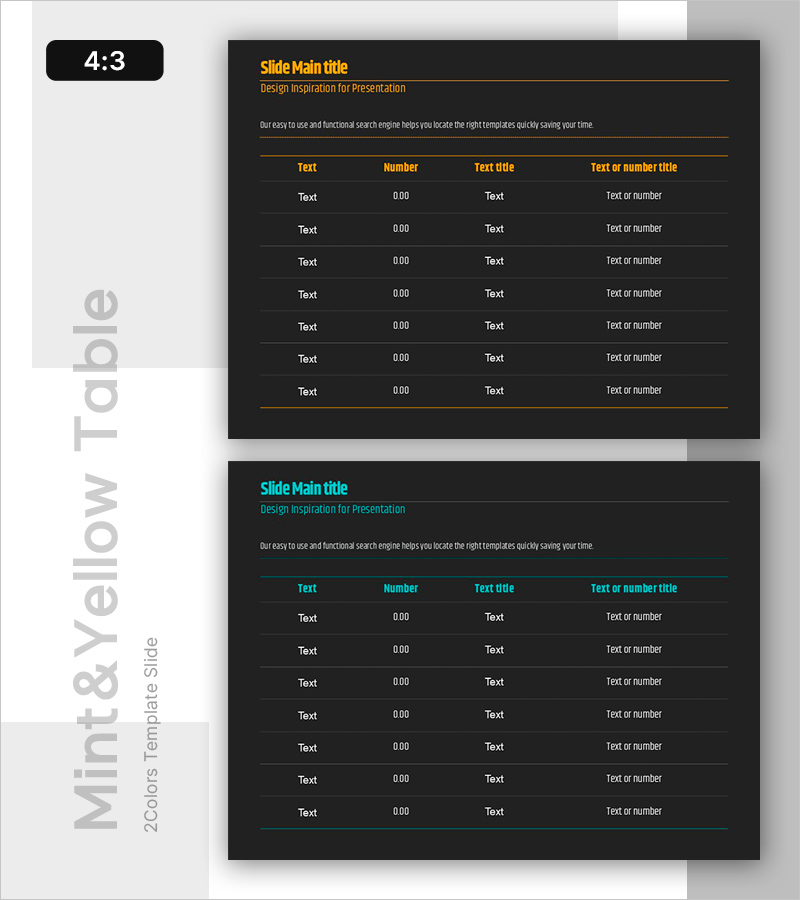
A data table PowerPoint slide featuring mint and yellow two-tone color scheme. The slide structure includes 4 columns and 7 rows for systematic information organization, allowing text, numbers, and titles to be compared at a glance. Set against a dark background with high-contrast header lines, it is ready to use for reports, business management, and performance analysis presentations. Two color layout versions are included to match your presentation tone.
Usage Points
-
Main Usage
An information organization tool for business management, performance reporting, and data comparison analysis. The 4-column (text, number, title, description) and 7-row structure displays multiple items' metrics and explanations simultaneously. Dark background header lines clearly distinguish information hierarchy.
-
How to Use
Use in reports and business management presentations to organize monthly results, departmental performance, project status, and similar data. The mint background version emphasizes trust and stability, while the yellow version suits data requiring attention and emphasis.
-
Recommended For
Finance, operations, and marketing professionals use this for regular reports, quarterly performance presentations, and budget status briefings. Recommended for executive, team leader, and project manager audiences requiring data-driven decision-making.
-
Slide Structure
2-slide set (4:3 aspect ratio). Each slide contains 4 columns (text, number, title, text/number title) and 7 data rows. Headers are distinguished by yellow or mint accent lines, with evenly spaced rows for optimal data readability.
Related Products
-

Flower Wide PPT Checklist – Emphasizing Visual Flow
#Product/Service Introduction #Business Management #Diagram
-

Tree PPT Year-by-Year Table – Market and Competitor Analysis
#Product/Service Introduction #Market and Competitor Analysis #Diagram
-

Data Visualization Diagram for Cosmetic Ingredient List
#Product/Service Introduction #Diagram #Composition
-

Eco-friendly Indicator Table – Sustainable Business Strategy
#Business Strategy #Business Management #Diagram
