Diet Table for Healthy Management – Your Path to Weight Loss
RJ0800048_7
- Last Update 08/14/2025
- File Size 0.5MB
- # of Slides 2
- File Format PPTX
- Slide Ratio 16:9
- Color
Keywords
- #Content-Based Slides
- #Design-Based Slides
- #Product/Service Introduction
- #Financial Plans and Performance
- #Diagram
- #Composition
- #Key Financial Indicators
- #Table
- #Standard Table
- #16:9
- #table PowerPoint slide
- #data table template
- #4-column 8-row table
- #information comparison slide
- #data visualization PowerPoint
About the Product
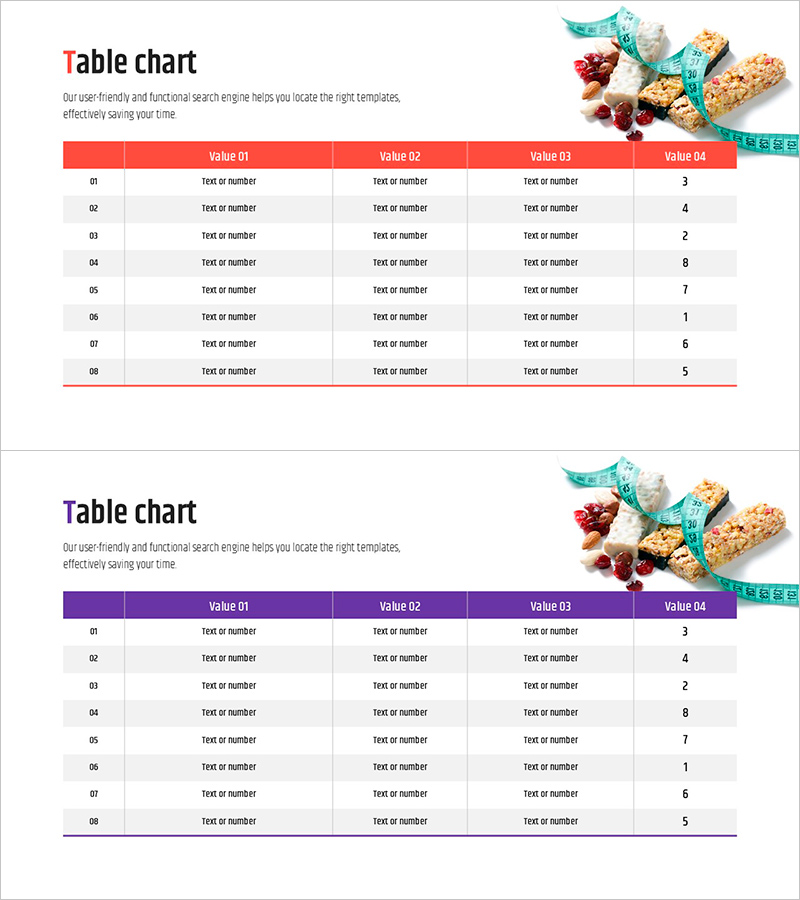
A versatile table PowerPoint slide designed for organizing and comparing data across diet management, financial planning, performance analysis, and more. Features 4 value columns (Value 01–04) and 8 data rows, available in both red and purple header color schemes. Each table uses a bold header row to establish clear information hierarchy, with row numbers (01–08) for systematic item management. The layout supports easy text and numeric input, making it ready for immediate use in presentations. Both color versions maintain consistent formatting for professional data visualization.
Usage Points
-
Main Usage
Presents numerical data, item-by-item information, and comparative analysis in a structured table format. Ideal for diet tracking tables, financial statements, performance scorecards, and any scenario requiring organized data visualization.
-
How to Use
Customize the header row labels (Value 01–04) to match your data categories, then populate each row (01–08) with corresponding information. Select either the red or purple version based on your presentation theme and content tone. Rows and columns can be added or adjusted as needed.
-
Recommended For
Nutritionists, fitness coaches, financial analysts, project managers, data scientists, and business professionals presenting quantitative information. Suitable for corporate reports, marketing analysis, operational status updates, and performance reviews.
-
Slide Structure
Two-slide set featuring red-header and purple-header table designs. Each table contains 4 value columns (Value 01, 02, 03, 04) and 8 data rows (01–08), with editable cells for text and numeric entries.
Related Products
-

Square Frame Presentation Template for Financial Performance – Efficiency and Clarity
#Financial Plans and Performance #Diagram #Cash Flow Statement
-

Organize Financial Plans with Abstract Pattern Template
#Financial Plans and Performance #Diagram #Balance Sheet
-

Colors Theme Presentation Template Table – Financial Planning and Performance
#Financial Plans and Performance #Diagram #Sales and Revenue
-

Triangular Pattern Presentation Template Pie Chart – Market Analysis and Strategy
#Market and Competitor Analysis #Financial Plans and Performance #Diagram
