Visualizing Business Strategies with Infographic Design Table
RJ0200064_28
- Last Update 04/17/2025
- File Size 0.2MB
- # of Slides 2
- File Format PPTX
- Slide Ratio 16:9
- Color
Keywords
- #Content-Based Slides
- #Design-Based Slides
- #Business Strategy
- #Business Management
- #Diagram
- #Marketing Plan
- #Reporting and Review Plan
- #Table
- #Standard Table
- #16:9
- #comparison table PowerPoint slide
- #infographic table template
- #business strategy visualization PPT
- #4-column comparison chart
- #data table slide design
About the Product
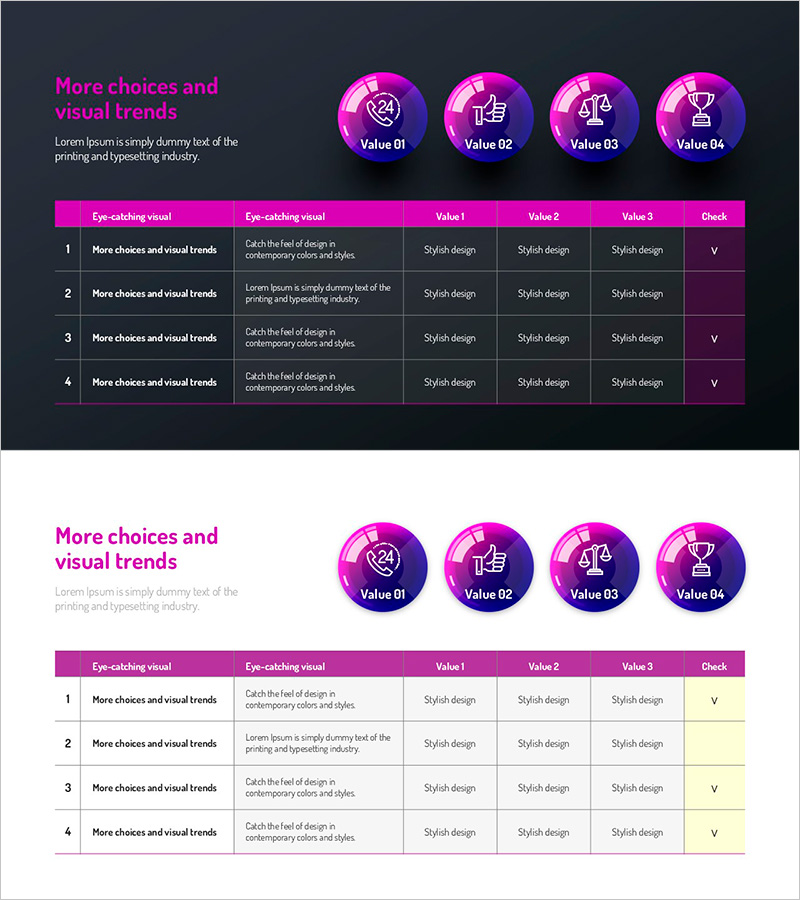
A 4-column comparison table PowerPoint slide designed to visualize business strategies and strategic initiatives. Features a magenta and dark gray two-tone background with four circular icons (clock, thumbs-up, balance scale, trophy) and structured data entry fields. Each column includes headers for 'Eye-catching visual', 'Eye-catching visual', 'Value 1', 'Value 2', 'Value 3', and 'Check' to support situational analysis, business management, and strategic comparison presentations. Provided as a 2-slide 16:9 widescreen PPTX file with fully editable text and data fields for immediate customization.
Usage Points
-
Main Usage
Optimized for systematically organizing and comparing four key items such as business strategies, situational analysis, product or service comparisons, and performance evaluations. The magenta circular icons and structured data fields make complex information easy to understand at a glance.
-
How to Use
Enter your strategic items, analysis categories, numerical values, and evaluation results into each column's header and data cells. The circular icons represent core concepts for each item and can be customized as needed. The magenta background and white text provide high contrast for clear visibility during presentations.
-
Recommended For
Ideal for business strategists, marketing managers, project managers, consultants, and executives preparing strategy reports, competitive analysis, performance evaluations, and decision-making materials. Particularly useful when presenting both quantitative comparisons and qualitative assessments simultaneously.
-
Slide Structure
Two-slide layout with the first slide featuring a dark gray background, magenta header row, and four-column data entry area. The second slide provides the same table structure on a light background. Each cell supports text input with four fixed data rows for consistent information organization.
Related Products
-

Schedule and Review Plan Diagram – Effective Business Execution
#Business Strategy #Business Management #Diagram
-

Growth Strategy PowerPoint Slide – Hub Market & 6-Month Plan
#Business Strategy #Marketing Plan and Strategy #Diagram
-

Flower Wide PPT Checklist – Emphasizing Visual Flow
#Product/Service Introduction #Business Management #Diagram
-

Eco-friendly Indicator Table – Sustainable Business Strategy
#Business Strategy #Business Management #Diagram
