Breaking Down Performance with Radar Chart – Clear Data Comparison
RB0800014_18
- Last Update 03/20/2025
- File Size 0.1MB
- # of Slides 2
- File Format PPTX
- Slide Ratio 4:3
- Color
Keywords
About the Product
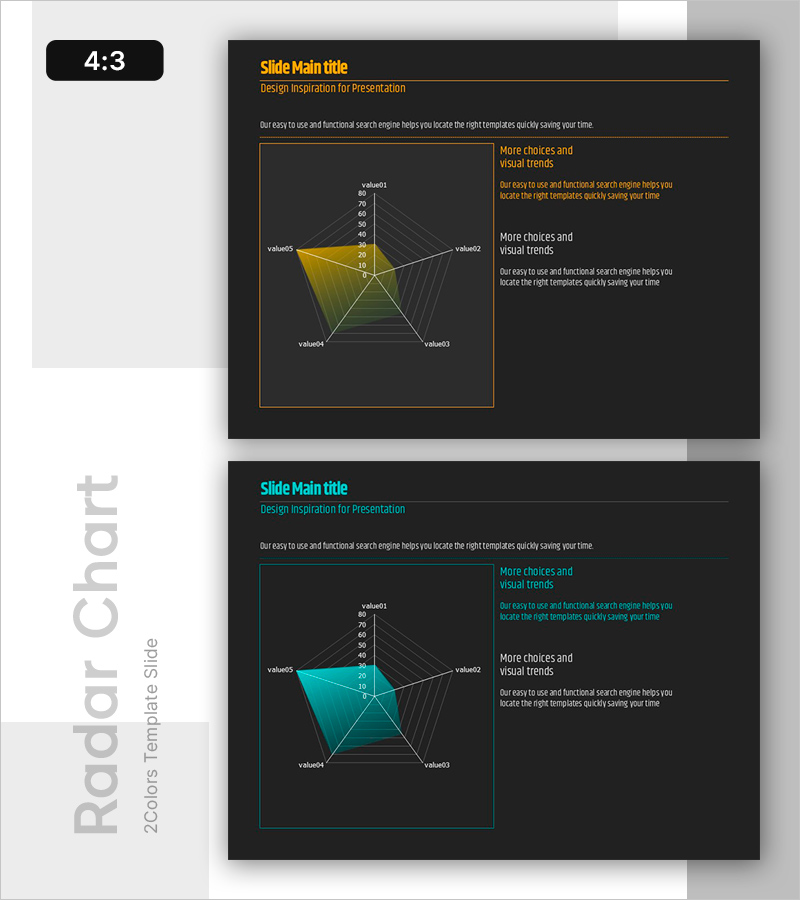
A dual-series radar chart PowerPoint slide comparing five performance metrics simultaneously. Set against a dark background, gold and cyan overlaid data series clearly reveal performance gaps and trends. Each axis displays a 0–80 numerical scale for precise quantitative comparison, making it ideal for executive reports, performance presentations, and analytical decks. The 2-slide set offers color variations (gold and cyan) to match your brand identity and presentation tone.
Usage Points
-
Main Usage
Optimized for simultaneous comparison of multiple performance indicators, competencies, and metrics. The radial structure enables instant comprehension of five-axis data, while overlaid dual-series visualization clearly highlights performance differences and trends.
-
How to Use
Perfect for executive briefings, business performance presentations, competency assessments, and competitive benchmarking. Simply replace axis labels and values with your data, and the slide is ready to present. Use color-variant slides to adjust presentation tone and brand alignment.
-
Recommended For
Executives, analysts, marketing managers, and project managers presenting performance reviews, capability assessments, and market comparisons. Particularly effective when comparing five or more evaluation criteria simultaneously with strong persuasive impact.
-
Slide Structure
Two-slide set with 5-axis radial chart. Slide 1: gold-series dual overlay; Slide 2: cyan-series dual overlay. Each axis labeled (value01–value05) with 0–80 scale. Right-side text area for supporting narrative and insights.
Related Products
-

Highlighting Product Features with Four Radial Graphs
#Product/Service Introduction #Graph #Features
-

Product Comparison Radar Chart – Competitive Advantage Analysis
#Product/Service Introduction #Market and Competitor Analysis #Graph
-

Competency Radar Chart – Business Vision and Strategy Introduction
#Product/Service Introduction #Business Vision and Strategy #Graph
-

Effects and Benefits of Functional Cosmetics – Emphasizing Design
#Product/Service Introduction #Graph #Features
