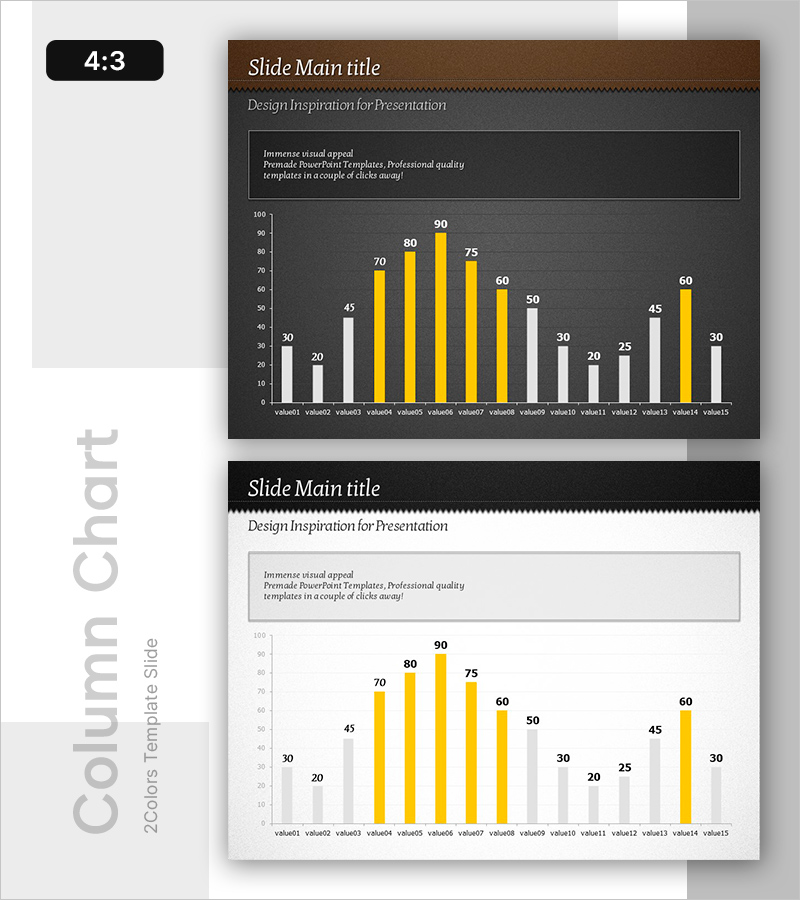
Yellow Vertical Bar Graph – Sales Growth Visualization
RB0800011_6
- Last Update 03/19/2025
- File Size 7.5MB
- # of Slides 2
- File Format PPTX
- Slide Ratio 4:3
- Color
Keywords
About the Product
A vertical bar chart PowerPoint slide template provided in two versions: dark background and light background. This presentation slide features 15 data items with yellow accent bars that highlight key metrics and make comparisons visually striking. Precise numerical labels appear above each bar for immediate presentation use. The slide design is ideal for sales growth analysis, quarterly performance reports, departmental comparisons, and any presentation requiring data-driven visual comparison in PowerPoint format.
Usage Points
-
Main Usage
Designed to compare multiple data points and emphasize relative magnitude differences at a glance. Yellow accent bars draw attention to key metrics and guide audience focus. Precise numerical labels above each bar enhance data credibility and clarity in presentations.
-
How to Use
Apply this chart to sales performance reports, quarterly results analysis, departmental KPI tracking, competitive benchmarking, and financial presentations. Use the dark background version for professional boardroom meetings and the light background version for seminars, training sessions, and bright-environment presentations.
-
Recommended For
Finance teams presenting quarterly earnings, sales departments showcasing performance metrics, executive leadership strategy meetings, investor relations and pitch deck presentations, marketing teams analyzing campaign ROI, and educators explaining statistical data in seminars.
-
Slide Structure
Two-slide set: dark background version (brown header with dark gray body) and light background version (brown header with white body). Each slide displays a 15-item vertical bar chart with 8 white bars and 7 yellow bars representing two-series data comparison. All bars include numerical value labels for precise data communication.
Related Products
-

Comparison Bar Chart for Market Competition Analysis – Competitive Advantage
#Market and Competitor Analysis #Graph #Other
-

Comparison Graph Before and After Growth – Business Insights
#Business Strategy #Market and Competitor Analysis #Graph
-

Sea Life Population Graph – Emphasizing Results Through Data Visualization
#Business Strategy #Graph #Text Box
-

Data Visualization Slide Template Featuring World Map
#Market and Competitor Analysis #Graph #Other
